Data
290,953 items of data are available, covering 275,241 participants.
Defined-instances run from 0 to 1, labelled using Instancing
2.
Units of measurement are mmol/l.
| Maximum | 0.19972 |
| Decile 9 | 0.046313 |
| Decile 8 | 0.039393 |
| Decile 7 | 0.034991 |
| Decile 6 | 0.031521 |
| Median | 0.028587 |
| Decile 4 | 0.025867 |
| Decile 3 | 0.023171 |
| Decile 2 | 0.020276 |
| Decile 1 | 0.016689 |
| Minimum | 2.9468e-07 |
|
|
- Mean = 0.0304243
- Std.dev = 0.0123439
- 1371 items above graph maximum of 0.075937
|
2 Instances
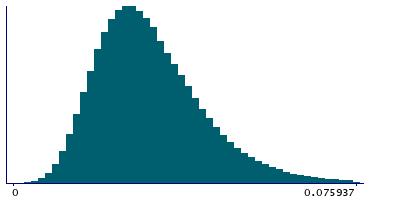
Instance 0 : Initial assessment visit (2006-2010) at which participants were recruited and consent given
274,250 participants, 274,250 items
| Maximum | 0.19972 |
| Decile 9 | 0.046337 |
| Decile 8 | 0.039387 |
| Decile 7 | 0.034971 |
| Decile 6 | 0.0315 |
| Median | 0.028564 |
| Decile 4 | 0.025842 |
| Decile 3 | 0.023147 |
| Decile 2 | 0.020242 |
| Decile 1 | 0.016648 |
| Minimum | 2.9468e-07 |
|

|
- Mean = 0.0304105
- Std.dev = 0.0123787
- 1317 items above graph maximum of 0.076026
|
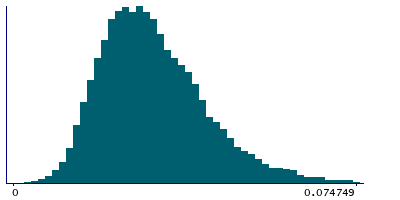
Instance 1 : First repeat assessment visit (2012-13)
16,703 participants, 16,703 items
| Maximum | 0.13224 |
| Decile 9 | 0.0460215 |
| Decile 8 | 0.0394715 |
| Decile 7 | 0.0353345 |
| Decile 6 | 0.031896 |
| Median | 0.028991 |
| Decile 4 | 0.0263275 |
| Decile 3 | 0.023606 |
| Decile 2 | 0.0208285 |
| Decile 1 | 0.017294 |
| Minimum | 0.0022075 |
|
|
- Mean = 0.0306504
- Std.dev = 0.0117561
- 51 items above graph maximum of 0.074749
|


