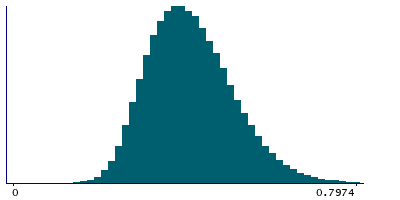
Data
290,953 items of data are available, covering 275,241 participants.
Defined-instances run from 0 to 1, labelled using Instancing
2.
Units of measurement are mmol/l.
| Maximum | 1.2217 |
| Decile 9 | 0.545045 |
| Decile 8 | 0.493525 |
| Decile 7 | 0.45865 |
| Decile 6 | 0.42968 |
| Median | 0.4038 |
| Decile 4 | 0.37901 |
| Decile 3 | 0.35395 |
| Decile 2 | 0.32681 |
| Decile 1 | 0.29269 |
| Minimum | 1.196e-07 |
|
|
- Mean = 0.41291
- Std.dev = 0.100039
- 398 items above graph maximum of 0.7974
|
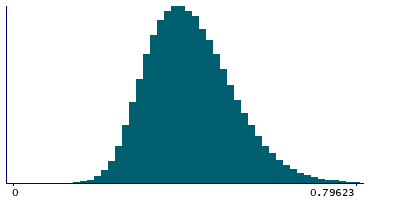
2 Instances
Instance 0 : Initial assessment visit (2006-2010) at which participants were recruited and consent given
274,250 participants, 274,250 items
| Maximum | 1.1938 |
| Decile 9 | 0.54413 |
| Decile 8 | 0.49259 |
| Decile 7 | 0.45772 |
| Decile 6 | 0.42884 |
| Median | 0.40301 |
| Decile 4 | 0.37821 |
| Decile 3 | 0.35322 |
| Decile 2 | 0.32614 |
| Decile 1 | 0.29203 |
| Minimum | 1.196e-07 |
|
|
- Mean = 0.412124
- Std.dev = 0.0999466
- 368 items above graph maximum of 0.79623
|
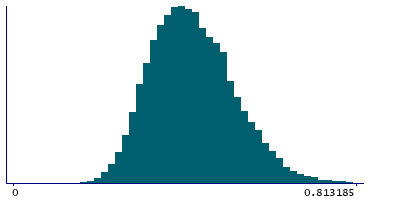
Instance 1 : First repeat assessment visit (2012-13)
16,703 participants, 16,703 items
| Maximum | 1.2217 |
| Decile 9 | 0.558805 |
| Decile 8 | 0.50612 |
| Decile 7 | 0.473435 |
| Decile 6 | 0.44334 |
| Median | 0.417365 |
| Decile 4 | 0.39197 |
| Decile 3 | 0.366375 |
| Decile 2 | 0.33893 |
| Decile 1 | 0.304425 |
| Minimum | 0.12665 |
|
|
- Mean = 0.425819
- Std.dev = 0.100671
- 28 items above graph maximum of 0.813185
|


