Data
290,953 items of data are available, covering 275,241 participants.
Defined-instances run from 0 to 1, labelled using Instancing
2.
Units of measurement are mmol/l.
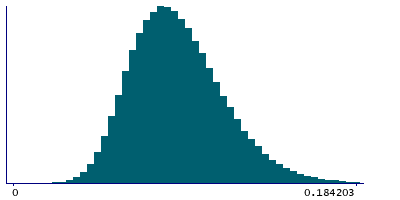
| Maximum | 0.28689 |
| Decile 9 | 0.1214 |
| Decile 8 | 0.10828 |
| Decile 7 | 0.099452 |
| Decile 6 | 0.092258 |
| Median | 0.0858775 |
| Decile 4 | 0.0798075 |
| Decile 3 | 0.0736975 |
| Decile 2 | 0.067002 |
| Decile 1 | 0.0585965 |
| Minimum | 1.9147e-07 |
|
|
- Mean = 0.0883759
- Std.dev = 0.0250701
- 495 items above graph maximum of 0.184203
|
2 Instances
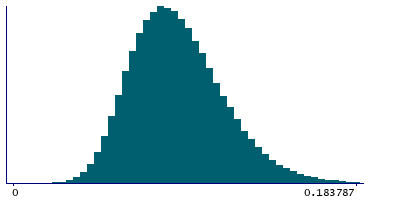
Instance 0 : Initial assessment visit (2006-2010) at which participants were recruited and consent given
274,250 participants, 274,250 items
| Maximum | 0.28344 |
| Decile 9 | 0.12113 |
| Decile 8 | 0.10803 |
| Decile 7 | 0.099211 |
| Decile 6 | 0.092037 |
| Median | 0.085682 |
| Decile 4 | 0.079631 |
| Decile 3 | 0.073522 |
| Decile 2 | 0.066858 |
| Decile 1 | 0.058473 |
| Minimum | 1.9147e-07 |
|
|
- Mean = 0.0881764
- Std.dev = 0.0250222
- 467 items above graph maximum of 0.183787
|
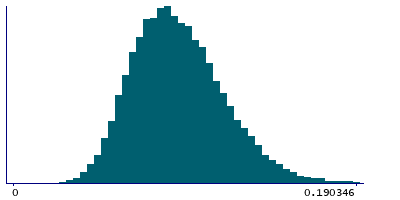
Instance 1 : First repeat assessment visit (2012-13)
16,703 participants, 16,703 items
| Maximum | 0.28689 |
| Decile 9 | 0.125605 |
| Decile 8 | 0.11208 |
| Decile 7 | 0.10336 |
| Decile 6 | 0.096019 |
| Median | 0.0892105 |
| Decile 4 | 0.082943 |
| Decile 3 | 0.076563 |
| Decile 2 | 0.069707 |
| Decile 1 | 0.0608635 |
| Minimum | 0.013876 |
|
|
- Mean = 0.0916525
- Std.dev = 0.025623
- 25 items above graph maximum of 0.190346
|


