Data
290,918 items of data are available, covering 275,209 participants.
Defined-instances run from 0 to 1, labelled using Instancing
2.
Units of measurement are percent.
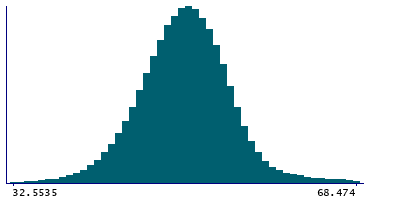
| Maximum | 95.792 |
| Decile 9 | 56.5005 |
| Decile 8 | 54.354 |
| Decile 7 | 52.944 |
| Decile 6 | 51.743 |
| Median | 50.616 |
| Decile 4 | 49.47 |
| Decile 3 | 48.227 |
| Decile 2 | 46.724 |
| Decile 1 | 44.527 |
| Minimum | 6.1735e-05 |
|
|
- Mean = 50.8275
- Std.dev = 6.00848
- 769 items below graph minimum of 32.5535
- 4464 items above graph maximum of 68.474
|
2 Instances
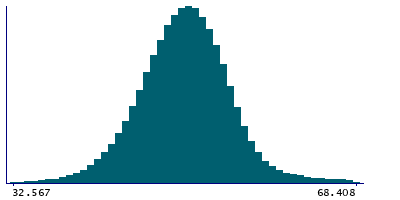
Instance 0 : Initial assessment visit (2006-2010) at which participants were recruited and consent given
274,217 participants, 274,217 items
| Maximum | 95.792 |
| Decile 9 | 56.461 |
| Decile 8 | 54.318 |
| Decile 7 | 52.911 |
| Decile 6 | 51.712 |
| Median | 50.5875 |
| Decile 4 | 49.443 |
| Decile 3 | 48.204 |
| Decile 2 | 46.7025 |
| Decile 1 | 44.514 |
| Minimum | 6.1735e-05 |
|
|
- Mean = 50.8002
- Std.dev = 6.00598
- 736 items below graph minimum of 32.567
- 4234 items above graph maximum of 68.408
|
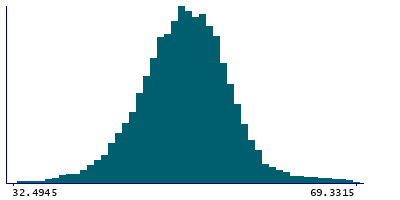
Instance 1 : First repeat assessment visit (2012-13)
16,701 participants, 16,701 items
| Maximum | 93.654 |
| Decile 9 | 57.0525 |
| Decile 8 | 54.8755 |
| Decile 7 | 53.508 |
| Decile 6 | 52.292 |
| Median | 51.0845 |
| Decile 4 | 49.9145 |
| Decile 3 | 48.598 |
| Decile 2 | 47.085 |
| Decile 1 | 44.7735 |
| Minimum | 4.0103 |
|
|
- Mean = 51.2748
- Std.dev = 6.03181
- 34 items below graph minimum of 32.4945
- 237 items above graph maximum of 69.3315
|


