Data
458,452 items of data are available, covering 210,947 participants.
Defined-instances run from 0 to 4, labelled using Instancing
1.
Units of measurement are mg.
| Maximum | 32813.3 |
| Decile 9 | 5196.05 |
| Decile 8 | 4347.92 |
| Decile 7 | 3847.98 |
| Decile 6 | 3469.88 |
| Median | 3149.69 |
| Decile 4 | 2860.11 |
| Decile 3 | 2574.89 |
| Decile 2 | 2264.44 |
| Decile 1 | 1863.87 |
| Minimum | 0 |
|

|
- Mean = 3385.12
- Std.dev = 1412.45
- 2669 items above graph maximum of 8528.22
|
5 Instances
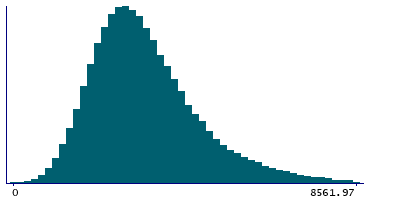
Instance 0 : Conducted in assessment centre, April 2009 to September 2010.
70,680 participants, 70,680 items
| Maximum | 25636.8 |
| Decile 9 | 5176.47 |
| Decile 8 | 4312.81 |
| Decile 7 | 3805.66 |
| Decile 6 | 3420.64 |
| Median | 3096.53 |
| Decile 4 | 2799.88 |
| Decile 3 | 2511.12 |
| Decile 2 | 2194.28 |
| Decile 1 | 1791.69 |
| Minimum | 0 |
|
|
- Mean = 3336.89
- Std.dev = 1444.17
- 417 items above graph maximum of 8561.25
|
Instance 1 : On-line cycle 1, February 2011 to April 2011.
100,568 participants, 100,568 items
| Maximum | 18756.7 |
| Decile 9 | 5203.24 |
| Decile 8 | 4366.29 |
| Decile 7 | 3874.66 |
| Decile 6 | 3495.27 |
| Median | 3175.26 |
| Decile 4 | 2887.43 |
| Decile 3 | 2604.99 |
| Decile 2 | 2295.04 |
| Decile 1 | 1895.51 |
| Minimum | 0 |
|

|
- Mean = 3409.07
- Std.dev = 1402.62
- 599 items above graph maximum of 8510.96
|
Instance 2 : On-line cycle 2, June 2011 to September 2011.
83,235 participants, 83,235 items
| Maximum | 21926.6 |
| Decile 9 | 5206.2 |
| Decile 8 | 4353.97 |
| Decile 7 | 3852.83 |
| Decile 6 | 3474.71 |
| Median | 3156.74 |
| Decile 4 | 2865.24 |
| Decile 3 | 2577.75 |
| Decile 2 | 2266.17 |
| Decile 1 | 1863.66 |
| Minimum | 0 |
|

|
- Mean = 3390.13
- Std.dev = 1412.48
- 463 items above graph maximum of 8548.75
|
Instance 3 : On-line cycle 3, October 2011 to December 2011.
103,755 participants, 103,755 items
| Maximum | 20166.3 |
| Decile 9 | 5167.06 |
| Decile 8 | 4324.39 |
| Decile 7 | 3826.52 |
| Decile 6 | 3457.68 |
| Median | 3141.5 |
| Decile 4 | 2853.01 |
| Decile 3 | 2568.88 |
| Decile 2 | 2263.38 |
| Decile 1 | 1868.65 |
| Minimum | 0 |
|

|
- Mean = 3371.81
- Std.dev = 1391.37
- 563 items above graph maximum of 8465.48
|
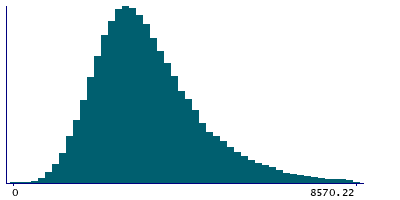
Instance 4 : On-line cycle 4, April 2012 to June 2012.
100,214 participants, 100,214 items
| Maximum | 32813.3 |
| Decile 9 | 5226.42 |
| Decile 8 | 4371.22 |
| Decile 7 | 3866.58 |
| Decile 6 | 3486.73 |
| Median | 3165.88 |
| Decile 4 | 2877.01 |
| Decile 3 | 2593.12 |
| Decile 2 | 2283.47 |
| Decile 1 | 1882.24 |
| Minimum | 0 |
|
|
- Mean = 3404.71
- Std.dev = 1420.27
- 619 items above graph maximum of 8570.61
|
