Data
51,610 items of data are available, covering 46,924 participants.
Defined-instances run from 2 to 3, labelled using Instancing
2.
Units of measurement are mm3.
| Maximum | 8892 |
| Decile 9 | 4285 |
| Decile 8 | 4027 |
| Decile 7 | 3845 |
| Decile 6 | 3697 |
| Median | 3564 |
| Decile 4 | 3436 |
| Decile 3 | 3301 |
| Decile 2 | 3145 |
| Decile 1 | 2933 |
| Minimum | 1168 |
|

|
- Mean = 3591.88
- Std.dev = 536.48
- 8 items below graph minimum of 1581
- 45 items above graph maximum of 5637
|
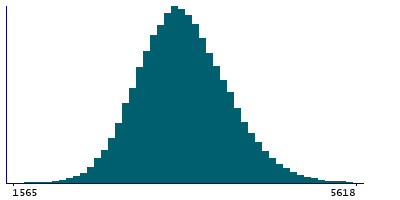
2 Instances
Instance 2 : Imaging visit (2014+)
46,852 participants, 46,852 items
| Maximum | 8892 |
| Decile 9 | 4284 |
| Decile 8 | 4027 |
| Decile 7 | 3843 |
| Decile 6 | 3696 |
| Median | 3564 |
| Decile 4 | 3436 |
| Decile 3 | 3300 |
| Decile 2 | 3145 |
| Decile 1 | 2933 |
| Minimum | 1168 |
|
|
- Mean = 3591.16
- Std.dev = 536.212
- 8 items below graph minimum of 1582
- 42 items above graph maximum of 5635
|
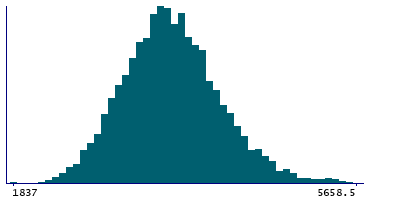
Instance 3 : First repeat imaging visit (2019+)
4,758 participants, 4,758 items
| Maximum | 6117 |
| Decile 9 | 4294 |
| Decile 8 | 4028 |
| Decile 7 | 3853 |
| Decile 6 | 3702 |
| Median | 3566 |
| Decile 4 | 3445 |
| Decile 3 | 3308.5 |
| Decile 2 | 3146 |
| Decile 1 | 2929 |
| Minimum | 1837 |
|
|
- Mean = 3599
- Std.dev = 539.055
- 3 items above graph maximum of 5659
|
Notes
Volume of posteriorcingulate in the left hemisphere generated by parcellation of the white surface using DKT parcellation
0 Related Data-Fields
There are no related data-fields
0 Resources
There are no matching Resources
