Data
2,544 items of data are available, covering 1,274 participants.
Defined-instances run from 2 to 3, labelled using Instancing
2.
| Maximum | 2 |
| Decile 9 | 2 |
| Decile 8 | 2 |
| Decile 7 | 2 |
| Decile 6 | 2 |
| Median | 2 |
| Decile 4 | 2 |
| Decile 3 | 2 |
| Decile 2 | 1 |
| Decile 1 | 1 |
| Minimum | 0 |
|
|
- There are 3 distinct values.
- Mean = 1.77673
- Std.dev = 0.464622
|
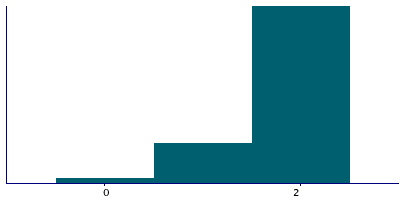
2 Instances
Instance 2 : Imaging visit (2014+)
1,271 participants, 1,271 items
| Maximum | 2 |
| Decile 9 | 2 |
| Decile 8 | 2 |
| Decile 7 | 2 |
| Decile 6 | 2 |
| Median | 2 |
| Decile 4 | 2 |
| Decile 3 | 2 |
| Decile 2 | 2 |
| Decile 1 | 1 |
| Minimum | 0 |
|
|
- There are 3 distinct values.
- Mean = 1.78521
- Std.dev = 0.459502
|
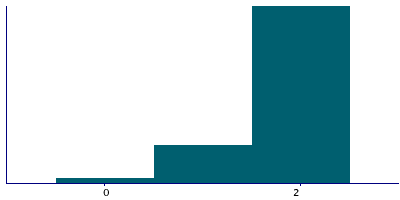
Instance 3 : First repeat imaging visit (2019+)
1,273 participants, 1,273 items
| Maximum | 2 |
| Decile 9 | 2 |
| Decile 8 | 2 |
| Decile 7 | 2 |
| Decile 6 | 2 |
| Median | 2 |
| Decile 4 | 2 |
| Decile 3 | 2 |
| Decile 2 | 1 |
| Decile 1 | 1 |
| Minimum | 0 |
|

|
- There are 3 distinct values.
- Mean = 1.76826
- Std.dev = 0.469525
|
Notes
Numerical shipment identifier. This project was performed in 3 batches. An initial pilot QC batch, and then two further processing batches.
These data were derived in association with project 76059.
0 Related Data-Fields
There are no related data-fields

