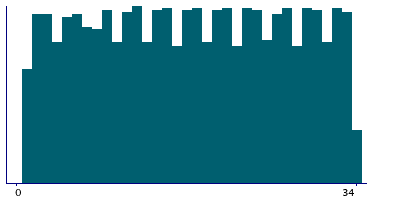
Data
2,544 items of data are available, covering 1,274 participants.
Defined-instances run from 2 to 3, labelled using Instancing
2.
| Maximum | 34 |
| Decile 9 | 31 |
| Decile 8 | 27 |
| Decile 7 | 24 |
| Decile 6 | 21 |
| Median | 17 |
| Decile 4 | 14 |
| Decile 3 | 11 |
| Decile 2 | 7 |
| Decile 1 | 4 |
| Minimum | 1 |
|
|
- There are 34 distinct values.
- Mean = 17.3589
- Std.dev = 9.55881
|
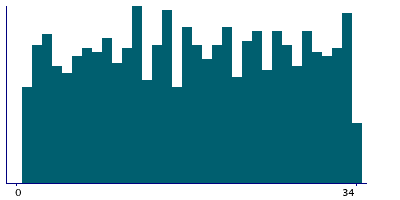
2 Instances
Instance 2 : Imaging visit (2014+)
1,271 participants, 1,271 items
| Maximum | 34 |
| Decile 9 | 31 |
| Decile 8 | 27 |
| Decile 7 | 24 |
| Decile 6 | 21 |
| Median | 17.5 |
| Decile 4 | 14 |
| Decile 3 | 11 |
| Decile 2 | 8 |
| Decile 1 | 4 |
| Minimum | 1 |
|
|
- There are 34 distinct values.
- Mean = 17.5437
- Std.dev = 9.59328
|
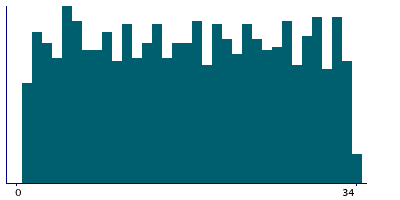
Instance 3 : First repeat imaging visit (2019+)
1,273 participants, 1,273 items
| Maximum | 34 |
| Decile 9 | 30 |
| Decile 8 | 27 |
| Decile 7 | 24 |
| Decile 6 | 20 |
| Median | 17 |
| Decile 4 | 14 |
| Decile 3 | 11 |
| Decile 2 | 7 |
| Decile 1 | 4 |
| Minimum | 1 |
|
|
- There are 34 distinct values.
- Mean = 17.1744
- Std.dev = 9.52069
|
Notes
For the pilot batch 1, samples were arranged in different well locations for the different assays, and field 31047 indicates both locations. For all other batches the well locations were the same for the different assays.
These data were derived in association with project 76059.
0 Related Data-Fields
There are no related data-fields

