Data
137,192 items of data are available, covering 132,976 participants.
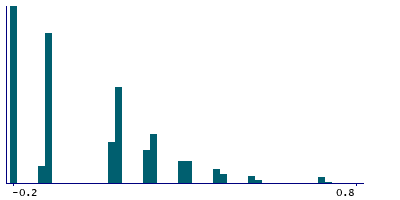
Defined-instances run from 0 to 1, labelled using Instancing
2.
| Maximum | 1.2 |
| Decile 9 | 0.3 |
| Decile 8 | 0.2 |
| Decile 7 | 0.1 |
| Decile 6 | 0.1 |
| Median | -0.1 |
| Decile 4 | -0.1 |
| Decile 3 | -0.1 |
| Decile 2 | -0.2 |
| Decile 1 | -0.2 |
| Minimum | -0.2 |
|

|
- Mean = 0.0336769
- Std.dev = 0.245689
- 3261 items above graph maximum of 0.8
|
2 Instances
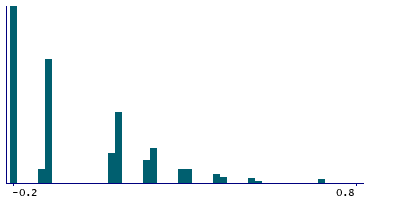
Instance 0 : Initial assessment visit (2006-2010) at which participants were recruited and consent given
117,012 participants, 117,012 items
| Maximum | 1.2 |
| Decile 9 | 0.3 |
| Decile 8 | 0.2 |
| Decile 7 | 0.1 |
| Decile 6 | 0.1 |
| Median | -0.1 |
| Decile 4 | -0.1 |
| Decile 3 | -0.1 |
| Decile 2 | -0.2 |
| Decile 1 | -0.2 |
| Minimum | -0.2 |
|
|
- Mean = 0.0379337
- Std.dev = 0.246276
- 2814 items above graph maximum of 0.8
|
Instance 1 : First repeat assessment visit (2012-13)
20,180 participants, 20,180 items
| Maximum | 1.2 |
| Decile 9 | 0.3 |
| Decile 8 | 0.2 |
| Decile 7 | 0.1 |
| Decile 6 | 0.1 |
| Median | -0.1 |
| Decile 4 | -0.1 |
| Decile 3 | -0.2 |
| Decile 2 | -0.2 |
| Decile 1 | -0.2 |
| Minimum | -0.2 |
|
|
- Mean = 0.00899405
- Std.dev = 0.24078
- 447 items above graph maximum of 0.8
|


