Data
12,352 items of data are available, covering 11,383 participants.
Defined-instances run from 0 to 1, labelled using Instancing
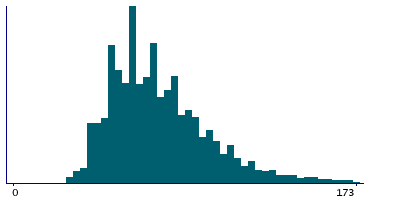
178.
Units of measurement are deciseconds.
| Maximum | 1155 |
| Decile 9 | 110 |
| Decile 8 | 93 |
| Decile 7 | 83 |
| Decile 6 | 76 |
| Median | 70 |
| Decile 4 | 63 |
| Decile 3 | 59 |
| Decile 2 | 52 |
| Decile 1 | 47 |
| Minimum | 10 |
|
|
- There are 203 distinct values.
- Mean = 74.8301
- Std.dev = 29.5261
- 90 items above graph maximum of 173
|
2 Instances
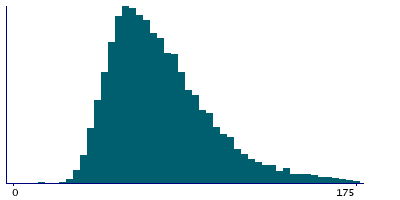
Instance 0 : Assessment run 2014
10,004 participants, 10,004 items
| Maximum | 1155 |
| Decile 9 | 111 |
| Decile 8 | 95 |
| Decile 7 | 85 |
| Decile 6 | 78 |
| Median | 71 |
| Decile 4 | 65 |
| Decile 3 | 59 |
| Decile 2 | 54 |
| Decile 1 | 47 |
| Minimum | 10 |
|
|
- There are 200 distinct values.
- Mean = 76.4556
- Std.dev = 30.4499
- 79 items above graph maximum of 175
|
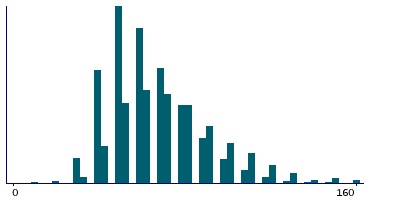
Instance 1 : Assessment run 2021
2,348 participants, 2,348 items
| Maximum | 260 |
| Decile 9 | 100 |
| Decile 8 | 80 |
| Decile 7 | 80 |
| Decile 6 | 70 |
| Median | 60 |
| Decile 4 | 60 |
| Decile 3 | 50 |
| Decile 2 | 50 |
| Decile 1 | 40 |
| Minimum | 10 |
|
|
- There are 21 distinct values.
- Mean = 67.9046
- Std.dev = 24.011
- 9 items above graph maximum of 160
|
Notes
Indicates how long a participant viewed question FI11 before selecting their answer and clicking Next.
1 Related Data-Field
| Field ID | Description | Relationship |
|---|
| 20185 | FI11 : antonym | Current Field is the duration spent viewing before entering the answer in Field 20185 |