Data
50,144 items of data are available, covering 46,691 participants.
Defined-instances run from 2 to 3, labelled using Instancing
2.
Units of measurement are g/cm2.
| Maximum | 2.15522 |
| Decile 9 | 1.04792 |
| Decile 8 | 0.969675 |
| Decile 7 | 0.914548 |
| Decile 6 | 0.867713 |
| Median | 0.824718 |
| Decile 4 | 0.781629 |
| Decile 3 | 0.737373 |
| Decile 2 | 0.689144 |
| Decile 1 | 0.626206 |
| Minimum | 0 |
|
|
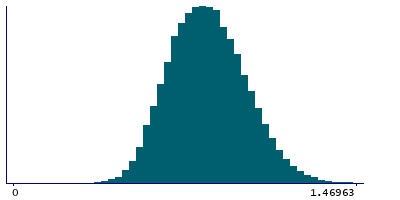
- Mean = 0.831679
- Std.dev = 0.163963
- 16 items above graph maximum of 1.46963
|
2 Instances
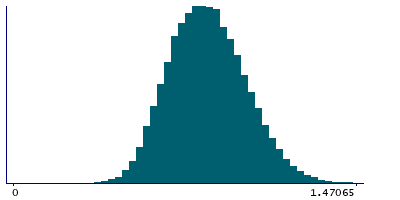
Instance 2 : Imaging visit (2014+)
46,238 participants, 46,238 items
| Maximum | 2.15522 |
| Decile 9 | 1.04883 |
| Decile 8 | 0.970496 |
| Decile 7 | 0.915159 |
| Decile 6 | 0.868286 |
| Median | 0.825151 |
| Decile 4 | 0.782159 |
| Decile 3 | 0.738135 |
| Decile 2 | 0.690042 |
| Decile 1 | 0.627011 |
| Minimum | 0 |
|
|
- Mean = 0.832406
- Std.dev = 0.164132
- 15 items above graph maximum of 1.47065
|
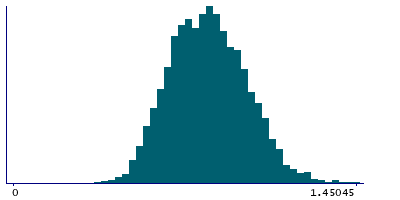
Instance 3 : First repeat imaging visit (2019+)
3,906 participants, 3,906 items
| Maximum | 1.49624 |
| Decile 9 | 1.03497 |
| Decile 8 | 0.961702 |
| Decile 7 | 0.907075 |
| Decile 6 | 0.859001 |
| Median | 0.818521 |
| Decile 4 | 0.773563 |
| Decile 3 | 0.727184 |
| Decile 2 | 0.681099 |
| Decile 1 | 0.619494 |
| Minimum | 0.365065 |
|
|
- Mean = 0.82308
- Std.dev = 0.161702
- 2 items above graph maximum of 1.45045
|