Data
78,246 items of data are available, covering 72,202 participants.
Defined-instances run from 2 to 3, labelled using Instancing
2.
Units of measurement are g/cm2.
| Maximum | 1.94259 |
| Decile 9 | 1.04756 |
| Decile 8 | 0.967387 |
| Decile 7 | 0.910353 |
| Decile 6 | 0.86093 |
| Median | 0.815552 |
| Decile 4 | 0.770773 |
| Decile 3 | 0.725636 |
| Decile 2 | 0.67543 |
| Decile 1 | 0.611781 |
| Minimum | 0 |
|

|
- Mean = 0.823748
- Std.dev = 0.169735
- 24 items above graph maximum of 1.48333
|
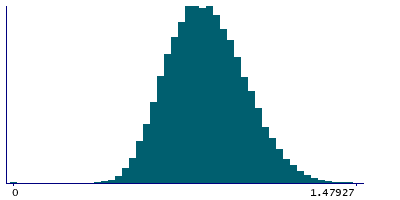
2 Instances
Instance 2 : Imaging visit (2014+)
71,935 participants, 71,935 items
| Maximum | 1.94259 |
| Decile 9 | 1.04797 |
| Decile 8 | 0.967671 |
| Decile 7 | 0.910843 |
| Decile 6 | 0.861061 |
| Median | 0.815748 |
| Decile 4 | 0.771053 |
| Decile 3 | 0.726023 |
| Decile 2 | 0.676044 |
| Decile 1 | 0.612097 |
| Minimum | 0 |
|
|
- Mean = 0.824084
- Std.dev = 0.169801
- 23 items above graph maximum of 1.48384
|
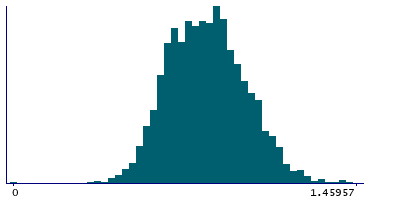
Instance 3 : First repeat imaging visit (2019+)
6,311 participants, 6,311 items
| Maximum | 1.48944 |
| Decile 9 | 1.04247 |
| Decile 8 | 0.964794 |
| Decile 7 | 0.905536 |
| Decile 6 | 0.860134 |
| Median | 0.812499 |
| Decile 4 | 0.767483 |
| Decile 3 | 0.720932 |
| Decile 2 | 0.669641 |
| Decile 1 | 0.607738 |
| Minimum | 0 |
|
|
- Mean = 0.819912
- Std.dev = 0.168925
- 2 items above graph maximum of 1.47721
|
Notes
Value output by DXA system.
This field was previously described as a percentage, however values actually represent fractions.
2 Related Data-Fields
| Field ID | Description | Relationship |
|---|
| 20158 | DXA images | Current Field is derived from the images in Field 20158 |
| 23214 | Femur troch BMD (bone mineral densit ... | Field 23214 is the opposite side complement to Current Field |