Data
51,182 items of data are available, covering 46,535 participants.
Defined-instances run from 2 to 3, labelled using Instancing
2.
Units of measurement are ratio.
| Maximum | 0.0274989 |
| Decile 9 | 0.017631 |
| Decile 8 | 0.01668 |
| Decile 7 | 0.0161003 |
| Decile 6 | 0.0156515 |
| Median | 0.0152626 |
| Decile 4 | 0.0148974 |
| Decile 3 | 0.0145423 |
| Decile 2 | 0.01415 |
| Decile 1 | 0.0136791 |
| Minimum | 0.0111566 |
|
|
- Mean = 0.0155138
- Std.dev = 0.0016644
- 322 items above graph maximum of 0.0215829
|
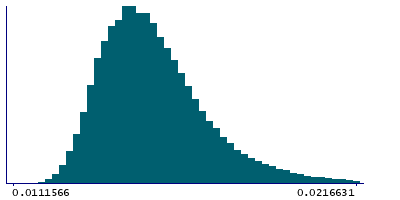
2 Instances
Instance 2 : Imaging visit (2014+)
46,398 participants, 46,398 items
| Maximum | 0.0274989 |
| Decile 9 | 0.0177001 |
| Decile 8 | 0.0167321 |
| Decile 7 | 0.0161477 |
| Decile 6 | 0.015697 |
| Median | 0.0153012 |
| Decile 4 | 0.0149367 |
| Decile 3 | 0.0145767 |
| Decile 2 | 0.0141786 |
| Decile 1 | 0.0137049 |
| Minimum | 0.0111566 |
|

|
- Mean = 0.0155583
- Std.dev = 0.00168149
- 286 items above graph maximum of 0.0216954
|
Instance 3 : First repeat imaging visit (2019+)
4,784 participants, 4,784 items
| Maximum | 0.0248716 |
| Decile 9 | 0.0169223 |
| Decile 8 | 0.0161621 |
| Decile 7 | 0.0156435 |
| Decile 6 | 0.0152352 |
| Median | 0.0148551 |
| Decile 4 | 0.0145438 |
| Decile 3 | 0.0142243 |
| Decile 2 | 0.0138874 |
| Decile 1 | 0.0134996 |
| Minimum | 0.0118571 |
|
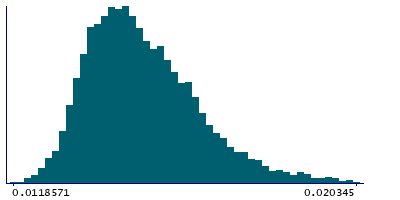
|
- Mean = 0.0150828
- Std.dev = 0.00141802
- 15 items above graph maximum of 0.020345
|
Notes
Inverted signal-to-noise ratio in the T1 - background spatial standard deviation divided by mean brain intensity
0 Related Data-Fields
There are no related data-fields
0 Resources
There are no matching Resources
