Data
51,177 items of data are available, covering 46,530 participants.
Defined-instances run from 2 to 3, labelled using Instancing
2.
Units of measurement are mm3.
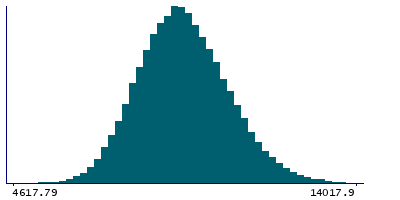
| Maximum | 17952.1 |
| Decile 9 | 10929.6 |
| Decile 8 | 10346.3 |
| Decile 7 | 9932.18 |
| Decile 6 | 9584.07 |
| Median | 9277.1 |
| Decile 4 | 8975.76 |
| Decile 3 | 8656.25 |
| Decile 2 | 8289.44 |
| Decile 1 | 7812.96 |
| Minimum | 2301.62 |
|

|
- Mean = 9336.97
- Std.dev = 1239.58
- 7 items below graph minimum of 4696.28
- 56 items above graph maximum of 14046.3
|
2 Instances
Instance 2 : Imaging visit (2014+)
46,393 participants, 46,393 items
| Maximum | 17952.1 |
| Decile 9 | 10940.3 |
| Decile 8 | 10361.1 |
| Decile 7 | 9941.5 |
| Decile 6 | 9593.43 |
| Median | 9283.8 |
| Decile 4 | 8982.59 |
| Decile 3 | 8665.74 |
| Decile 2 | 8296.46 |
| Decile 1 | 7815.61 |
| Minimum | 2301.62 |
|
|
- Mean = 9345.11
- Std.dev = 1242.62
- 6 items below graph minimum of 4690.91
- 53 items above graph maximum of 14065
|
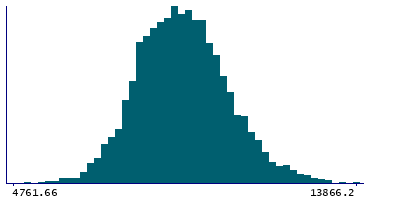
Instance 3 : First repeat imaging visit (2019+)
4,784 participants, 4,784 items
| Maximum | 15612.8 |
| Decile 9 | 10831.4 |
| Decile 8 | 10230 |
| Decile 7 | 9832.95 |
| Decile 6 | 9515.51 |
| Median | 9216.66 |
| Decile 4 | 8906.6 |
| Decile 3 | 8583.12 |
| Decile 2 | 8233.41 |
| Decile 1 | 7796.52 |
| Minimum | 3966.65 |
|
|
- Mean = 9258.09
- Std.dev = 1206.84
- 1 item below graph minimum of 4761.66
- 4 items above graph maximum of 13866.2
|
Notes
Volume of grey matter in Right Temporal Pole
0 Related Data-Fields
There are no related data-fields
0 Resources
There are no matching Resources
