Data
22,992 items of data are available, covering 22,992 participants.
Defined-instances run from 2 to 3, labelled using Instancing
2.
Units of measurement are seconds.
| Maximum | 1100 |
| Decile 9 | 154 |
| Decile 8 | 148 |
| Decile 7 | 141 |
| Decile 6 | 136 |
| Median | 131 |
| Decile 4 | 127 |
| Decile 3 | 123 |
| Decile 2 | 119 |
| Decile 1 | 106 |
| Minimum | 3 |
|
|
- There are 211 distinct values.
- Mean = 131.35
- Std.dev = 22.5276
- 78 items below graph minimum of 58
- 43 items above graph maximum of 202
|
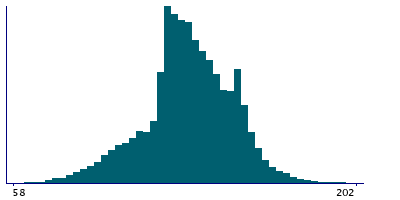
2 Instances
Instance 2 : Imaging visit (2014+)
19,601 participants, 19,601 items
| Maximum | 1100 |
| Decile 9 | 154 |
| Decile 8 | 148 |
| Decile 7 | 141 |
| Decile 6 | 136 |
| Median | 132 |
| Decile 4 | 128 |
| Decile 3 | 124 |
| Decile 2 | 119 |
| Decile 1 | 107 |
| Minimum | 3 |
|

|
- There are 209 distinct values.
- Mean = 131.65
- Std.dev = 23.0184
- 79 items below graph minimum of 60
- 41 items above graph maximum of 201
|
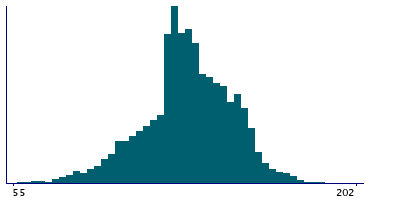
Instance 3 : First repeat imaging visit (2019+)
3,391 participants, 3,391 items
| Maximum | 276 |
| Decile 9 | 153 |
| Decile 8 | 146 |
| Decile 7 | 140 |
| Decile 6 | 134 |
| Median | 130 |
| Decile 4 | 126 |
| Decile 3 | 122 |
| Decile 2 | 116 |
| Decile 1 | 104 |
| Minimum | 38 |
|
|
- There are 126 distinct values.
- Mean = 129.614
- Std.dev = 19.3585
- 2 items below graph minimum of 55
- 4 items above graph maximum of 202
|
Notes
This is the interval between the participant ending the test due to reaching the incorrect-answer threshold or being timed-out.
0 Related Data-Fields
There are no related data-fields