Data
331,532 items of data are available, covering 287,095 participants.
Some values have special meanings defined by Data-Coding
100298.
Defined-instances run from 0 to 3, labelled using Instancing
2.
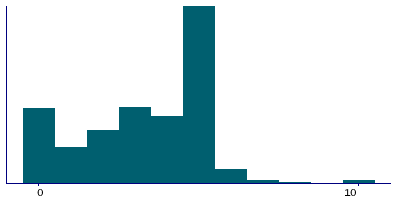
Units of measurement are times.
| Maximum | 200 |
| Decile 9 | 5 |
| Decile 8 | 5 |
| Decile 7 | 5 |
| Decile 6 | 5 |
| Median | 5 |
| Decile 4 | 5 |
| Decile 3 | 4 |
| Decile 2 | 3 |
| Decile 1 | 1 |
| Minimum | 0 |
|
|
- There are 63 distinct values.
- Mean = 4.17041
- Std.dev = 2.20266
- 3851 items above graph maximum of 9
- 3429 items have value -10 (Less than once a week)
- 1369 items have value -3 (Prefer not to answer)
- 2330 items have value -1 (Do not know)
|
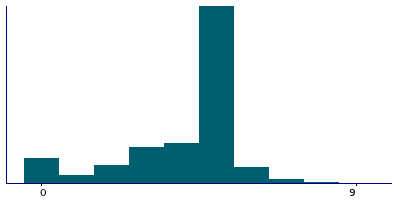
4 Instances
Instance 0 : Initial assessment visit (2006-2010) at which participants were recruited and consent given
284,435 participants, 284,435 items
| Maximum | 200 |
| Decile 9 | 5 |
| Decile 8 | 5 |
| Decile 7 | 5 |
| Decile 6 | 5 |
| Median | 5 |
| Decile 4 | 5 |
| Decile 3 | 4 |
| Decile 2 | 3 |
| Decile 1 | 2 |
| Minimum | 0 |
|
|
- There are 60 distinct values.
- Mean = 4.28811
- Std.dev = 2.12754
- 3501 items above graph maximum of 8
- 2243 items have value -10 (Less than once a week)
- 1212 items have value -3 (Prefer not to answer)
- 1990 items have value -1 (Do not know)
|
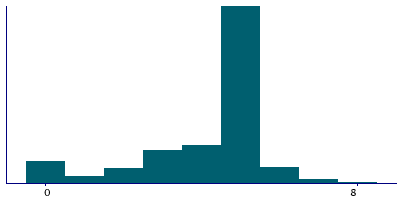
Instance 1 : First repeat assessment visit (2012-13)
8,292 participants, 8,292 items
| Maximum | 80 |
| Decile 9 | 5 |
| Decile 8 | 5 |
| Decile 7 | 5 |
| Decile 6 | 5 |
| Median | 5 |
| Decile 4 | 4 |
| Decile 3 | 3 |
| Decile 2 | 2 |
| Decile 1 | 0 |
| Minimum | 0 |
|
|
- There are 23 distinct values.
- Mean = 3.93209
- Std.dev = 2.45737
- 30 items above graph maximum of 10
- 101 items have value -10 (Less than once a week)
- 26 items have value -3 (Prefer not to answer)
- 51 items have value -1 (Do not know)
|
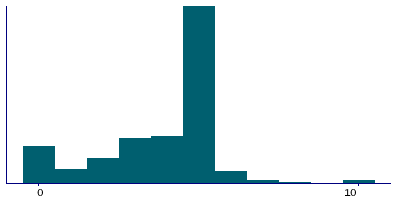
Instance 2 : Imaging visit (2014+)
33,398 participants, 33,398 items
| Maximum | 90 |
| Decile 9 | 5 |
| Decile 8 | 5 |
| Decile 7 | 5 |
| Decile 6 | 4 |
| Median | 4 |
| Decile 4 | 3 |
| Decile 3 | 2 |
| Decile 2 | 1 |
| Decile 1 | 0 |
| Minimum | 0 |
|
|
- There are 35 distinct values.
- Mean = 3.36793
- Std.dev = 2.5021
- 131 items above graph maximum of 10
- 952 items have value -10 (Less than once a week)
- 117 items have value -3 (Prefer not to answer)
- 252 items have value -1 (Do not know)
|
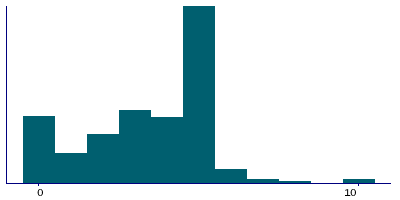
Instance 3 : First repeat imaging visit (2019+)
5,407 participants, 5,407 items
| Maximum | 56 |
| Decile 9 | 5 |
| Decile 8 | 5 |
| Decile 7 | 5 |
| Decile 6 | 4 |
| Median | 3 |
| Decile 4 | 3 |
| Decile 3 | 2 |
| Decile 2 | 1 |
| Decile 1 | 0 |
| Minimum | 0 |
|
|
- There are 22 distinct values.
- Mean = 3.18189
- Std.dev = 2.44335
- 27 items above graph maximum of 10
- 133 items have value -10 (Less than once a week)
- 14 items have value -3 (Prefer not to answer)
- 37 items have value -1 (Do not know)
|
Notes
ACE touchscreen question "How many times a WEEK do you travel from home to your main work? (count outward journeys only; put 0 if you always work from home)"
The following checks were performed:
- If answer < 0 then rejected
- If answer > 999 then rejected
- If answer > 99 then participant asked to confirm
If the participant activated the Help button they were shown the message:
If the number of times varies each week, take an average over the last 4 weeks.
If you only work from home please enter 0
|
Field 777 was collected from the participants who indicated they were in paid employment or self-employed, as defined by their answers to Field 6142
Coding 100298 defines 3 special values:
- -10 represents "Less than once a week"
- -1 represents "Do not know"
- -3 represents "Prefer not to answer"
3 Related Data-Fields
| Field ID | Description | Relationship |
|---|
| 6142 | Current employment status | Current Field was collected from the participants who indicated they were in paid employment or self-employed, as defined by their answers to Field 6142 |
| 796 | Distance between home and job workplace | Current Field affects who was asked to answer Field 796 |
| 6143 | Transport type for commuting to job ... | Current Field affects who was asked to answer Field 6143 |


