Data
4,105,476 items of data are available, covering 229,495 participants.
Defined-instances run from 0 to 3, labelled using Instancing
2.
Array indices run from 1 to 15.
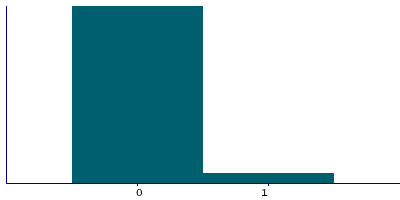
| Maximum | 69 |
| Decile 9 | 0 |
| Decile 8 | 0 |
| Decile 7 | 0 |
| Decile 6 | 0 |
| Median | 0 |
| Decile 4 | 0 |
| Decile 3 | 0 |
| Decile 2 | 0 |
| Decile 1 | 0 |
| Minimum | 0 |
|
|
- There are 40 distinct values.
- Mean = 0.0945101
- Std.dev = 0.473566
- 61704 items above graph maximum of 1
|
4 Instances
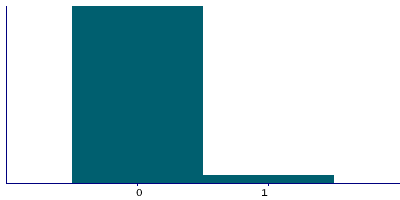
Instance 0 : Initial assessment visit (2006-2010) at which participants were recruited and consent given
166,181 participants, 2,460,830 items
| Maximum | 67 |
| Decile 9 | 0 |
| Decile 8 | 0 |
| Decile 7 | 0 |
| Decile 6 | 0 |
| Median | 0 |
| Decile 4 | 0 |
| Decile 3 | 0 |
| Decile 2 | 0 |
| Decile 1 | 0 |
| Minimum | 0 |
|
|
- There are 38 distinct values.
- Mean = 0.0877383
- Std.dev = 0.493027
- 38327 items above graph maximum of 1
|
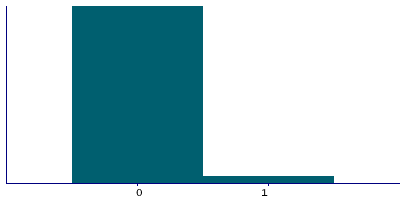
Instance 1 : First repeat assessment visit (2012-13)
20,017 participants, 298,068 items
| Maximum | 28 |
| Decile 9 | 0 |
| Decile 8 | 0 |
| Decile 7 | 0 |
| Decile 6 | 0 |
| Median | 0 |
| Decile 4 | 0 |
| Decile 3 | 0 |
| Decile 2 | 0 |
| Decile 1 | 0 |
| Minimum | 0 |
|
|
- There are 22 distinct values.
- Mean = 0.0753788
- Std.dev = 0.429249
- 3812 items above graph maximum of 1
|
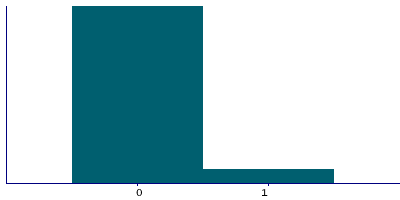
Instance 2 : Imaging visit (2014+)
82,123 participants, 1,216,911 items
| Maximum | 69 |
| Decile 9 | 0 |
| Decile 8 | 0 |
| Decile 7 | 0 |
| Decile 6 | 0 |
| Median | 0 |
| Decile 4 | 0 |
| Decile 3 | 0 |
| Decile 2 | 0 |
| Decile 1 | 0 |
| Minimum | 0 |
|
|
- There are 27 distinct values.
- Mean = 0.112728
- Std.dev = 0.451444
- 18129 items above graph maximum of 1
|
Instance 3 : First repeat imaging visit (2019+)
8,679 participants, 129,667 items
| Maximum | 24 |
| Decile 9 | 0 |
| Decile 8 | 0 |
| Decile 7 | 0 |
| Decile 6 | 0 |
| Median | 0 |
| Decile 4 | 0 |
| Decile 3 | 0 |
| Decile 2 | 0 |
| Decile 1 | 0 |
| Minimum | 0 |
|

|
- There are 15 distinct values.
- Mean = 0.0960306
- Std.dev = 0.382713
- 1436 items above graph maximum of 1
|