Data
4,107,054 items of data are available, covering 229,593 participants.
Defined-instances run from 0 to 3, labelled using Instancing
2.
Array indices run from 1 to 15.
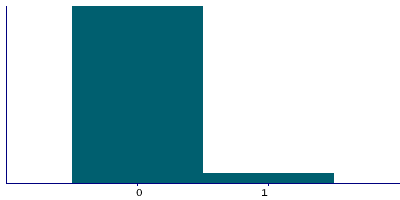
| Maximum | 74 |
| Decile 9 | 0 |
| Decile 8 | 0 |
| Decile 7 | 0 |
| Decile 6 | 0 |
| Median | 0 |
| Decile 4 | 0 |
| Decile 3 | 0 |
| Decile 2 | 0 |
| Decile 1 | 0 |
| Minimum | 0 |
|
|
- There are 41 distinct values.
- Mean = 0.0934083
- Std.dev = 0.469234
- 61381 items above graph maximum of 1
|
4 Instances
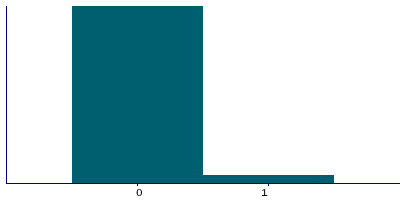
Instance 0 : Initial assessment visit (2006-2010) at which participants were recruited and consent given
166,228 participants, 2,460,522 items
| Maximum | 58 |
| Decile 9 | 0 |
| Decile 8 | 0 |
| Decile 7 | 0 |
| Decile 6 | 0 |
| Median | 0 |
| Decile 4 | 0 |
| Decile 3 | 0 |
| Decile 2 | 0 |
| Decile 1 | 0 |
| Minimum | 0 |
|
|
- There are 39 distinct values.
- Mean = 0.0872985
- Std.dev = 0.491133
- 38459 items above graph maximum of 1
|
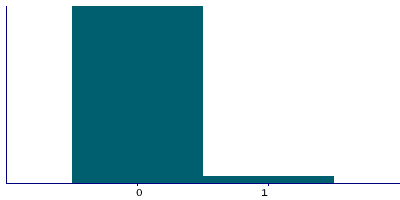
Instance 1 : First repeat assessment visit (2012-13)
20,025 participants, 298,222 items
| Maximum | 74 |
| Decile 9 | 0 |
| Decile 8 | 0 |
| Decile 7 | 0 |
| Decile 6 | 0 |
| Median | 0 |
| Decile 4 | 0 |
| Decile 3 | 0 |
| Decile 2 | 0 |
| Decile 1 | 0 |
| Minimum | 0 |
|
|
- There are 23 distinct values.
- Mean = 0.0728384
- Std.dev = 0.433536
- 3675 items above graph maximum of 1
|
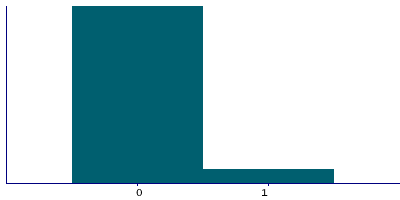
Instance 2 : Imaging visit (2014+)
82,192 participants, 1,218,525 items
| Maximum | 26 |
| Decile 9 | 0 |
| Decile 8 | 0 |
| Decile 7 | 0 |
| Decile 6 | 0 |
| Median | 0 |
| Decile 4 | 0 |
| Decile 3 | 0 |
| Decile 2 | 0 |
| Decile 1 | 0 |
| Minimum | 0 |
|
|
- There are 24 distinct values.
- Mean = 0.11083
- Std.dev = 0.439923
- 17821 items above graph maximum of 1
|
Instance 3 : First repeat imaging visit (2019+)
8,693 participants, 129,785 items
| Maximum | 18 |
| Decile 9 | 0 |
| Decile 8 | 0 |
| Decile 7 | 0 |
| Decile 6 | 0 |
| Median | 0 |
| Decile 4 | 0 |
| Decile 3 | 0 |
| Decile 2 | 0 |
| Decile 1 | 0 |
| Minimum | 0 |
|

|
- There are 16 distinct values.
- Mean = 0.0929383
- Std.dev = 0.375759
- 1426 items above graph maximum of 1
|