Data
1,155,326 items of data are available, covering 476,035 participants.
Defined-instances run from 0 to 3, labelled using Instancing
2.
Array indices run from 0 to 1.
Units of measurement are bpm.
| Maximum | 174 |
| Decile 9 | 84 |
| Decile 8 | 78 |
| Decile 7 | 74 |
| Decile 6 | 71 |
| Median | 68 |
| Decile 4 | 65 |
| Decile 3 | 62 |
| Decile 2 | 59 |
| Decile 1 | 55 |
| Minimum | 30 |
|
|
- There are 136 distinct values.
- Mean = 68.9019
- Std.dev = 11.5143
- 1820 items above graph maximum of 113
|
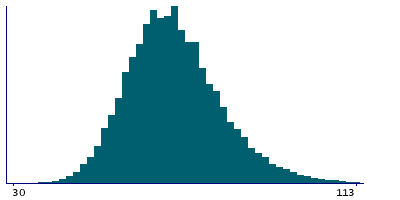
4 Instances
Instance 0 : Initial assessment visit (2006-2010) at which participants were recruited and consent given
471,854 participants, 928,304 items
| Maximum | 174 |
| Decile 9 | 84 |
| Decile 8 | 78 |
| Decile 7 | 74 |
| Decile 6 | 71 |
| Median | 68 |
| Decile 4 | 66 |
| Decile 3 | 63 |
| Decile 2 | 60 |
| Decile 1 | 56 |
| Minimum | 30 |
|
|
- There are 134 distinct values.
- Mean = 69.3349
- Std.dev = 11.4539
- 1720 items above graph maximum of 112
|
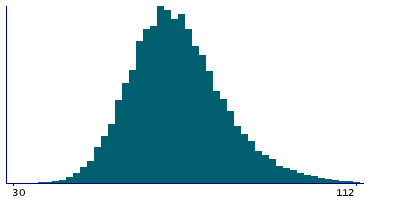
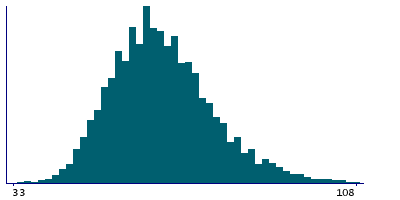
Instance 1 : First repeat assessment visit (2012-13)
20,267 participants, 40,353 items
| Maximum | 150 |
| Decile 9 | 81 |
| Decile 8 | 75 |
| Decile 7 | 71 |
| Decile 6 | 68 |
| Median | 66 |
| Decile 4 | 63 |
| Decile 3 | 60 |
| Decile 2 | 57 |
| Decile 1 | 54 |
| Minimum | 32 |
|
|
- There are 102 distinct values.
- Mean = 66.4759
- Std.dev = 11.0175
- 108 items above graph maximum of 108
|
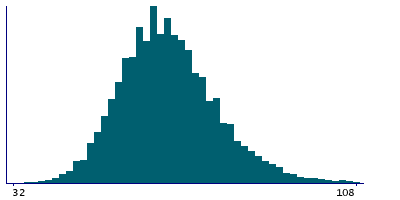
Instance 2 : Imaging visit (2014+)
82,728 participants, 160,239 items
| Maximum | 159 |
| Decile 9 | 83 |
| Decile 8 | 77 |
| Decile 7 | 72 |
| Decile 6 | 69 |
| Median | 66 |
| Decile 4 | 64 |
| Decile 3 | 61 |
| Decile 2 | 58 |
| Decile 1 | 54 |
| Minimum | 31 |
|
|
- There are 118 distinct values.
- Mean = 67.4633
- Std.dev = 11.722
- 276 items above graph maximum of 112
|
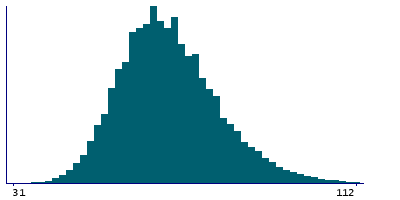
Instance 3 : First repeat imaging visit (2019+)
13,539 participants, 26,430 items
| Maximum | 157 |
| Decile 9 | 81 |
| Decile 8 | 75 |
| Decile 7 | 71 |
| Decile 6 | 68 |
| Median | 65 |
| Decile 4 | 62 |
| Decile 3 | 60 |
| Decile 2 | 57 |
| Decile 1 | 52 |
| Minimum | 30 |
|
|
- There are 100 distinct values.
- Mean = 66.1182
- Std.dev = 11.5447
- 36 items above graph maximum of 110
|


