Data
103,754 items of data are available, covering 90,599 participants.
Defined-instances run from 2 to 3, labelled using Instancing
2.
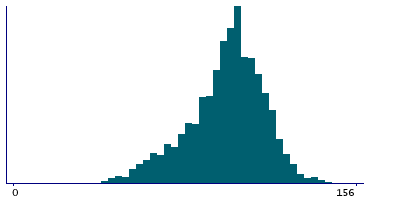
Units of measurement are ms.
| Maximum | 222 |
| Decile 9 | 118 |
| Decile 8 | 112 |
| Decile 7 | 106 |
| Decile 6 | 102 |
| Median | 100 |
| Decile 4 | 96 |
| Decile 3 | 92 |
| Decile 2 | 84 |
| Decile 1 | 74 |
| Minimum | 20 |
|

|
- There are 71 distinct values.
- Mean = 97.2441
- Std.dev = 17.0585
- 7 items above graph maximum of 162
|
2 Instances
Instance 2 : Imaging visit (2014+)
87,245 participants, 87,245 items
| Maximum | 222 |
| Decile 9 | 118 |
| Decile 8 | 112 |
| Decile 7 | 106 |
| Decile 6 | 102 |
| Median | 100 |
| Decile 4 | 96 |
| Decile 3 | 92 |
| Decile 2 | 84 |
| Decile 1 | 74 |
| Minimum | 20 |
|

|
- There are 69 distinct values.
- Mean = 97.3744
- Std.dev = 16.9681
- 6 items above graph maximum of 162
|
Instance 3 : First repeat imaging visit (2019+)
16,509 participants, 16,509 items
| Maximum | 208 |
| Decile 9 | 116 |
| Decile 8 | 112 |
| Decile 7 | 106 |
| Decile 6 | 102 |
| Median | 98 |
| Decile 4 | 96 |
| Decile 3 | 90 |
| Decile 2 | 82 |
| Decile 1 | 72 |
| Minimum | 40 |
|
|
- There are 58 distinct values.
- Mean = 96.5556
- Std.dev = 17.5127
- 1 item above graph maximum of 160
|
Notes
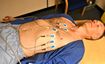
P duration during ECG
0 Related Data-Fields
There are no related data-fields