Data
109,012 items of data are available, covering 94,863 participants.
Defined-instances run from 2 to 3, labelled using Instancing
2.
| Maximum | 15 |
| Decile 9 | 7 |
| Decile 8 | 6 |
| Decile 7 | 6 |
| Decile 6 | 6 |
| Median | 5 |
| Decile 4 | 5 |
| Decile 3 | 5 |
| Decile 2 | 5 |
| Decile 1 | 5 |
| Minimum | 1 |
|
|
- There are 15 distinct values.
- Mean = 5.72016
- Std.dev = 0.920476
- 33 items below graph minimum of 3
- 396 items above graph maximum of 9
|
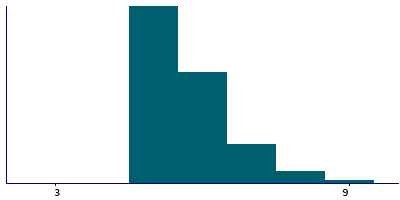
2 Instances
Instance 2 : Imaging visit (2014+)
91,707 participants, 91,707 items
| Maximum | 15 |
| Decile 9 | 7 |
| Decile 8 | 6 |
| Decile 7 | 6 |
| Decile 6 | 6 |
| Median | 5 |
| Decile 4 | 5 |
| Decile 3 | 5 |
| Decile 2 | 5 |
| Decile 1 | 5 |
| Minimum | 1 |
|

|
- There are 15 distinct values.
- Mean = 5.72035
- Std.dev = 0.919948
- 32 items below graph minimum of 3
- 329 items above graph maximum of 9
|
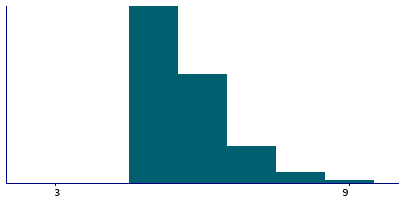
Instance 3 : First repeat imaging visit (2019+)
17,305 participants, 17,305 items
| Maximum | 12 |
| Decile 9 | 7 |
| Decile 8 | 6 |
| Decile 7 | 6 |
| Decile 6 | 6 |
| Median | 5 |
| Decile 4 | 5 |
| Decile 3 | 5 |
| Decile 2 | 5 |
| Decile 1 | 5 |
| Minimum | 2 |
|
|
- There are 10 distinct values.
- Mean = 5.71916
- Std.dev = 0.923265
- 1 item below graph minimum of 3
- 67 items above graph maximum of 9
|