Data
205,733 items of data are available, covering 88,069 participants.
Defined-instances run from 2 to 3, labelled using Instancing
2.
Array indices run from 0 to 5.
Units of measurement are mmHg.
| Maximum | 211 |
| Decile 9 | 162 |
| Decile 8 | 152 |
| Decile 7 | 146 |
| Decile 6 | 141 |
| Median | 136 |
| Decile 4 | 132 |
| Decile 3 | 127 |
| Decile 2 | 122 |
| Decile 1 | 115 |
| Minimum | 9 |
|

|
- There are 202 distinct values.
- Mean = 136.675
- Std.dev = 20.6025
- 1637 items below graph minimum of 68
- 23 items above graph maximum of 209
|
2 Instances
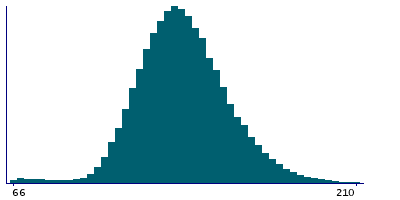
Instance 2 : Imaging visit (2014+)
85,414 participants, 168,955 items
| Maximum | 211 |
| Decile 9 | 162 |
| Decile 8 | 152 |
| Decile 7 | 146 |
| Decile 6 | 141 |
| Median | 136 |
| Decile 4 | 132 |
| Decile 3 | 127 |
| Decile 2 | 122 |
| Decile 1 | 114 |
| Minimum | 9 |
|
|
- There are 202 distinct values.
- Mean = 136.745
- Std.dev = 20.7434
- 1236 items below graph minimum of 66
- 3 items above graph maximum of 210
|
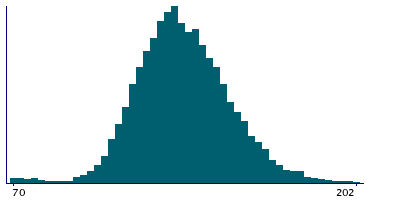
Instance 3 : First repeat imaging visit (2019+)
18,588 participants, 36,778 items
| Maximum | 210 |
| Decile 9 | 160 |
| Decile 8 | 151 |
| Decile 7 | 145 |
| Decile 6 | 140 |
| Median | 136 |
| Decile 4 | 131 |
| Decile 3 | 127 |
| Decile 2 | 122 |
| Decile 1 | 115 |
| Minimum | 13 |
|
|
- There are 188 distinct values.
- Mean = 136.353
- Std.dev = 19.9395
- 292 items below graph minimum of 70
- 37 items above graph maximum of 205
|
Notes
Central systolic blood pressure during PWA
0 Related Data-Fields
There are no related data-fields

