Data
205,501 items of data are available, covering 88,054 participants.
Defined-instances run from 2 to 3, labelled using Instancing
2.
Array indices run from 0 to 5.
Units of measurement are mmHg.
| Maximum | 89 |
| Decile 9 | 24 |
| Decile 8 | 20 |
| Decile 7 | 17 |
| Decile 6 | 15 |
| Median | 13 |
| Decile 4 | 11 |
| Decile 3 | 9 |
| Decile 2 | 7 |
| Decile 1 | 5 |
| Minimum | -79 |
|

|
- Mean = 13.8865
- Std.dev = 8.29425
- 490 items below graph minimum of -14
- 902 items above graph maximum of 43
|
2 Instances
Instance 2 : Imaging visit (2014+)
85,398 participants, 168,741 items
| Maximum | 89 |
| Decile 9 | 25 |
| Decile 8 | 20 |
| Decile 7 | 17 |
| Decile 6 | 15 |
| Median | 13 |
| Decile 4 | 11 |
| Decile 3 | 9 |
| Decile 2 | 7 |
| Decile 1 | 5 |
| Minimum | -79 |
|

|
- Mean = 13.9283
- Std.dev = 8.45116
- 419 items below graph minimum of -15
- 570 items above graph maximum of 45
|
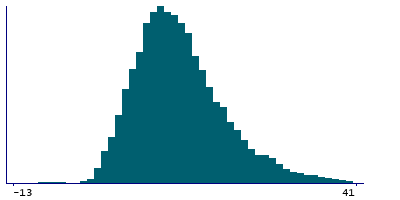
Instance 3 : First repeat imaging visit (2019+)
18,586 participants, 36,760 items
| Maximum | 79 |
| Decile 9 | 23 |
| Decile 8 | 19 |
| Decile 7 | 16 |
| Decile 6 | 14 |
| Median | 13 |
| Decile 4 | 11 |
| Decile 3 | 10 |
| Decile 2 | 8 |
| Decile 1 | 5 |
| Minimum | -55 |
|
|
- Mean = 13.6947
- Std.dev = 7.52918
- 50 items below graph minimum of -13
- 205 items above graph maximum of 41
|
Notes
Central augmentation pressure during PWA
Note that this field is arrayed to enable representation of the 5 measures of BP acquired during and immediately after the Aortic Distensibility image acquisiton.
1 Related Data-Field
| Field ID | Description | Relationship |
|---|
| 12681 | Augmentation index for PWA - PVR | Field 12681 is partly derived from Current Field |

