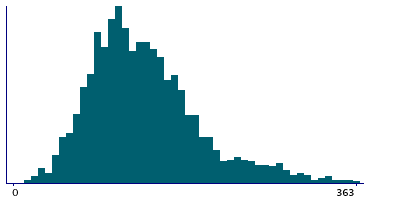
Data
1,651 items of data are available, covering 1,600 participants.
Defined-instances run from 0 to 1, labelled using Instancing
178.
Units of measurement are deciseconds.
| Maximum | 7089 |
| Decile 9 | 218 |
| Decile 8 | 180 |
| Decile 7 | 160 |
| Decile 6 | 145 |
| Median | 130 |
| Decile 4 | 116 |
| Decile 3 | 104 |
| Decile 2 | 90 |
| Decile 1 | 73 |
| Minimum | 14 |
|
|
- There are 286 distinct values.
- Mean = 145.959
- Std.dev = 187.138
- 15 items above graph maximum of 363
|
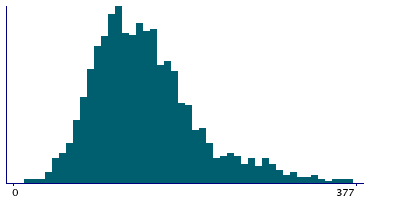
2 Instances
Instance 0 : Assessment run 2014
1,442 participants, 1,442 items
| Maximum | 7089 |
| Decile 9 | 229 |
| Decile 8 | 187 |
| Decile 7 | 167 |
| Decile 6 | 151 |
| Median | 137 |
| Decile 4 | 123.5 |
| Decile 3 | 111 |
| Decile 2 | 98 |
| Decile 1 | 81 |
| Minimum | 14 |
|
|
- There are 284 distinct values.
- Mean = 153.258
- Std.dev = 198.571
- 12 items above graph maximum of 377
|
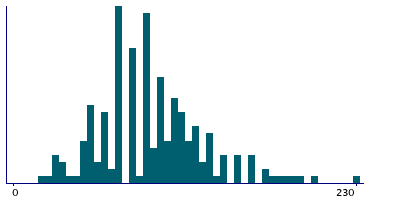
Instance 1 : Assessment run 2021
209 participants, 209 items
| Maximum | 300 |
| Decile 9 | 140 |
| Decile 8 | 120 |
| Decile 7 | 110 |
| Decile 6 | 100 |
| Median | 90 |
| Decile 4 | 80 |
| Decile 3 | 70 |
| Decile 2 | 65 |
| Decile 1 | 50 |
| Minimum | 20 |
|
|
- There are 22 distinct values.
- Mean = 95.5981
- Std.dev = 41.1294
- 3 items above graph maximum of 230
|