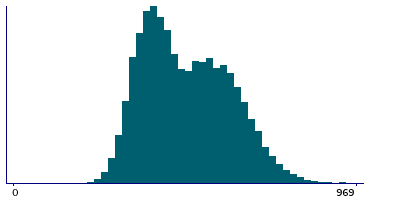
Data
33,709 items of data are available, covering 32,824 participants.
Defined-instances run from 2 to 3, labelled using Instancing
2.
Units of measurement are g.
| Maximum | 1031 |
| Decile 9 | 653 |
| Decile 8 | 602 |
| Decile 7 | 559 |
| Decile 6 | 516 |
| Median | 472 |
| Decile 4 | 432 |
| Decile 3 | 400 |
| Decile 2 | 371 |
| Decile 1 | 337 |
| Minimum | 62 |
|
|
- There are 673 distinct values.
- Mean = 485.864
- Std.dev = 122.465
- 1 item above graph maximum of 969
|
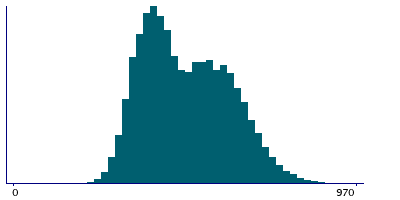
2 Instances
Instance 2 : Imaging visit (2014+)
29,928 participants, 29,928 items
| Maximum | 1031 |
| Decile 9 | 653 |
| Decile 8 | 602 |
| Decile 7 | 558 |
| Decile 6 | 516 |
| Median | 471 |
| Decile 4 | 432 |
| Decile 3 | 400 |
| Decile 2 | 371 |
| Decile 1 | 337 |
| Minimum | 62 |
|
|
- There are 669 distinct values.
- Mean = 485.572
- Std.dev = 122.369
- 1 item above graph maximum of 969
|
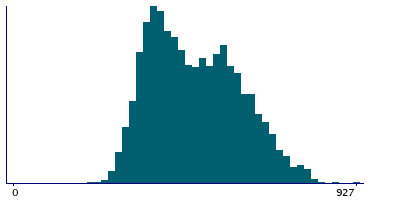
Instance 3 : First repeat imaging visit (2019+)
3,781 participants, 3,781 items
| Maximum | 927 |
| Decile 9 | 657 |
| Decile 8 | 603 |
| Decile 7 | 562 |
| Decile 6 | 520 |
| Median | 477 |
| Decile 4 | 436 |
| Decile 3 | 401 |
| Decile 2 | 371 |
| Decile 1 | 337 |
| Minimum | 196 |
|
|
- There are 543 distinct values.
- Mean = 488.176
- Std.dev = 123.203
|
Notes
Value output by DXA system
1 Related Data-Field
| Field ID | Description | Relationship |
|---|
| 21128 | Leg bone mass (right) | Current Field is the opposite-side complement to Field 21128 |
0 Resources
There are no matching Resources
