Data
121,837 items of data are available, covering 101,022 participants.
Defined-instances run from 2 to 3, labelled using Instancing
2.
Units of measurement are seconds.
| Maximum | 52129 |
| Decile 9 | 4009 |
| Decile 8 | 3541 |
| Decile 7 | 3252 |
| Decile 6 | 3031 |
| Median | 2845 |
| Decile 4 | 2672 |
| Decile 3 | 2502 |
| Decile 2 | 2323 |
| Decile 1 | 2102 |
| Minimum | 753 |
|

|
- There are 5928 distinct values.
- Mean = 3036.86
- Std.dev = 1163.42
- 1701 items above graph maximum of 5916
|
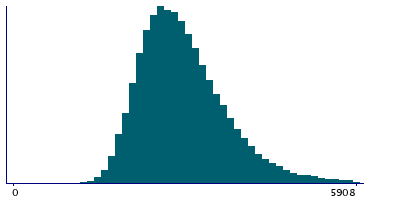
2 Instances
Instance 2 : Imaging visit (2014+)
100,917 participants, 100,917 items
| Maximum | 52129 |
| Decile 9 | 4017 |
| Decile 8 | 3547 |
| Decile 7 | 3254 |
| Decile 6 | 3031 |
| Median | 2845 |
| Decile 4 | 2672 |
| Decile 3 | 2502 |
| Decile 2 | 2323 |
| Decile 1 | 2102 |
| Minimum | 753 |
|
|
- There are 5751 distinct values.
- Mean = 3048.26
- Std.dev = 1209.37
- 1544 items above graph maximum of 5932
|
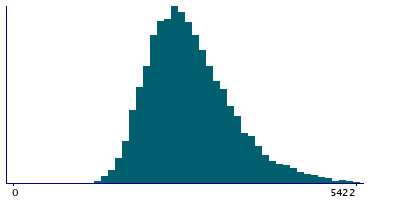
Instance 3 : First repeat imaging visit (2019+)
20,920 participants, 20,920 items
| Maximum | 17846 |
| Decile 9 | 3973 |
| Decile 8 | 3520 |
| Decile 7 | 3244 |
| Decile 6 | 3028 |
| Median | 2840 |
| Decile 4 | 2671 |
| Decile 3 | 2503 |
| Decile 2 | 2320 |
| Decile 1 | 2103 |
| Minimum | 1138 |
|
|
- There are 3592 distinct values.
- Mean = 2981.9
- Std.dev = 907.764
- 158 items above graph maximum of 5843
|
Notes
Touchscreen duration at imaging clinic.
0 Related Data-Fields
There are no related data-fields
0 Resources
There are no matching Resources
