Data
103,063 items of data are available, covering 89,586 participants.
Defined-instances run from 2 to 3, labelled using Instancing
2.
Units of measurement are seconds.
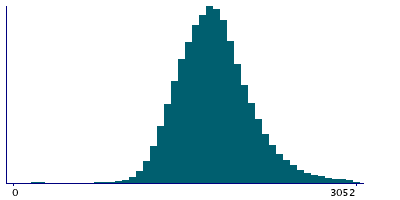
| Maximum | 63299 |
| Decile 9 | 2173 |
| Decile 8 | 1991 |
| Decile 7 | 1878 |
| Decile 6 | 1789 |
| Median | 1708 |
| Decile 4 | 1629 |
| Decile 3 | 1551 |
| Decile 2 | 1467 |
| Decile 1 | 1363 |
| Minimum | 137 |
|
|
- There are 2881 distinct values.
- Mean = 1759.78
- Std.dev = 531.739
- 785 items above graph maximum of 2983
|
2 Instances
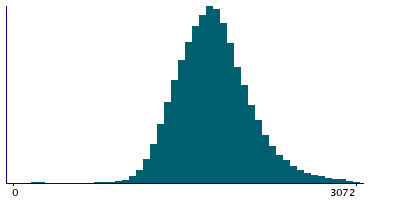
Instance 2 : Imaging visit (2014+)
83,124 participants, 83,124 items
| Maximum | 63299 |
| Decile 9 | 2195 |
| Decile 8 | 2013 |
| Decile 7 | 1899 |
| Decile 6 | 1809.5 |
| Median | 1728 |
| Decile 4 | 1647 |
| Decile 3 | 1566 |
| Decile 2 | 1478 |
| Decile 1 | 1370 |
| Minimum | 137 |
|
|
- There are 2749 distinct values.
- Mean = 1778.81
- Std.dev = 557.698
- 620 items above graph maximum of 3020
|
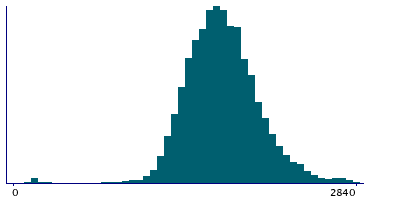
Instance 3 : First repeat imaging visit (2019+)
19,939 participants, 19,939 items
| Maximum | 14043 |
| Decile 9 | 2055 |
| Decile 8 | 1887 |
| Decile 7 | 1787 |
| Decile 6 | 1703 |
| Median | 1633 |
| Decile 4 | 1567 |
| Decile 3 | 1499 |
| Decile 2 | 1430 |
| Decile 1 | 1341 |
| Minimum | 139 |
|
|
- There are 1774 distinct values.
- Mean = 1680.46
- Std.dev = 396.294
- 170 items above graph maximum of 2769
|
Notes
Touchscreen cognitive duration
0 Related Data-Fields
There are no related data-fields
0 Resources
There are no matching Resources
