Data
466,632 items of data are available, covering 394,110 participants.
Defined-instances run from 0 to 3, labelled using Instancing
2.
Units of measurement are minutes.
| Maximum | 540 |
| Decile 9 | 270 |
| Decile 8 | 200 |
| Decile 7 | 150 |
| Decile 6 | 120 |
| Median | 100 |
| Decile 4 | 85 |
| Decile 3 | 65 |
| Decile 2 | 50 |
| Decile 1 | 30 |
| Minimum | 0 |
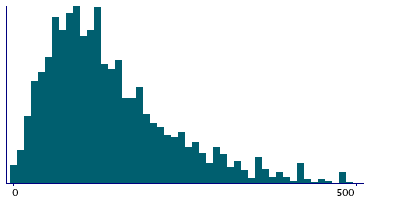
|
|
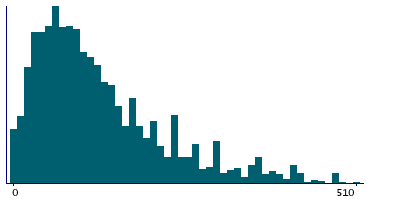
- There are 405 distinct values.
- Mean = 128.559
- Std.dev = 99.0848
- 1740 items above graph maximum of 510
|
4 Instances
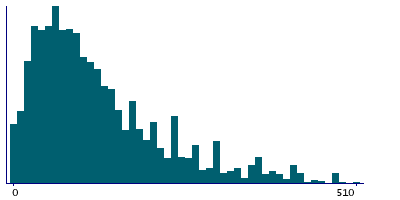
Instance 0 : Initial assessment visit (2006-2010) at which participants were recruited and consent given
384,836 participants, 384,836 items
| Maximum | 540 |
| Decile 9 | 270 |
| Decile 8 | 195 |
| Decile 7 | 150 |
| Decile 6 | 120 |
| Median | 100 |
| Decile 4 | 80 |
| Decile 3 | 60 |
| Decile 2 | 45 |
| Decile 1 | 30 |
| Minimum | 0 |
|
|
- There are 395 distinct values.
- Mean = 127.338
- Std.dev = 100.221
- 1539 items above graph maximum of 510
|
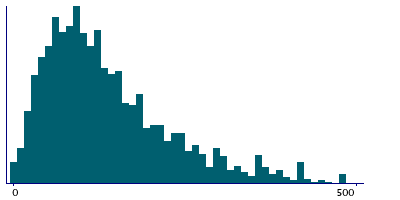
Instance 1 : First repeat assessment visit (2012-13)
17,287 participants, 17,287 items
| Maximum | 540 |
| Decile 9 | 240 |
| Decile 8 | 180 |
| Decile 7 | 145 |
| Decile 6 | 120 |
| Median | 100 |
| Decile 4 | 80 |
| Decile 3 | 60 |
| Decile 2 | 50 |
| Decile 1 | 30 |
| Minimum | 0 |
|
|
- There are 198 distinct values.
- Mean = 119.962
- Std.dev = 88.9745
- 77 items above graph maximum of 450
|
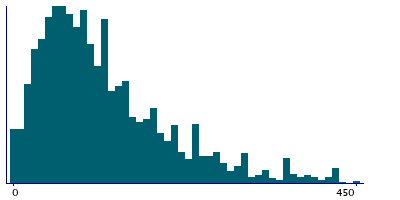
Instance 2 : Imaging visit (2014+)
59,243 participants, 59,243 items
| Maximum | 540 |
| Decile 9 | 270 |
| Decile 8 | 210 |
| Decile 7 | 165 |
| Decile 6 | 135 |
| Median | 120 |
| Decile 4 | 95 |
| Decile 3 | 80 |
| Decile 2 | 60 |
| Decile 1 | 40 |
| Minimum | 0 |
|
|
- There are 294 distinct values.
- Mean = 137.947
- Std.dev = 94.1762
- 173 items above graph maximum of 500
|
Instance 3 : First repeat imaging visit (2019+)
5,266 participants, 5,266 items
| Maximum | 540 |
| Decile 9 | 270 |
| Decile 8 | 210 |
| Decile 7 | 170 |
| Decile 6 | 140 |
| Median | 120 |
| Decile 4 | 100 |
| Decile 3 | 80 |
| Decile 2 | 60 |
| Decile 1 | 40 |
| Minimum | 0 |
|
|
- There are 118 distinct values.
- Mean = 140.41
- Std.dev = 93.2773
- 19 items above graph maximum of 500
|


