Data
116,345 items of data are available, covering 97,584 participants.
Some values have special meanings defined by Data-Coding
909.
Defined-instances run from 2 to 4, labelled using Instancing
2.
Units of measurement are micrometres.
| Maximum | 2450 |
| Decile 9 | 880 |
| Decile 8 | 801 |
| Decile 7 | 748 |
| Decile 6 | 706 |
| Median | 670 |
| Decile 4 | 638 |
| Decile 3 | 606 |
| Decile 2 | 572 |
| Decile 1 | 530 |
| Minimum | 198 |
|

|
- Mean = 692.023
- Std.dev = 144.579
- 454 items above graph maximum of 1230
- 302 items have value 0 (Measure invalid)
|
2 Instances
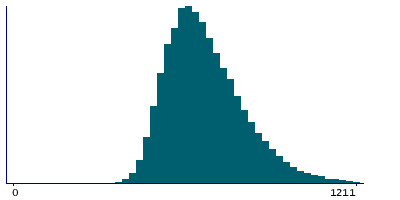
Instance 2 : Imaging visit (2014+)
96,696 participants, 96,414 items
| Maximum | 2450 |
| Decile 9 | 877 |
| Decile 8 | 797 |
| Decile 7 | 745 |
| Decile 6 | 703 |
| Median | 668 |
| Decile 4 | 636 |
| Decile 3 | 604 |
| Decile 2 | 570 |
| Decile 1 | 528 |
| Minimum | 198 |
|
|
- Mean = 689.389
- Std.dev = 143.667
- 363 items above graph maximum of 1226
- 282 items have value 0 (Measure invalid)
|
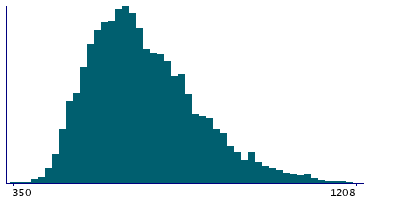
Instance 3 : First repeat imaging visit (2019+)
19,620 participants, 19,600 items
| Maximum | 1915 |
| Decile 9 | 896 |
| Decile 8 | 818 |
| Decile 7 | 763 |
| Decile 6 | 721 |
| Median | 684 |
| Decile 4 | 650 |
| Decile 3 | 616 |
| Decile 2 | 580 |
| Decile 1 | 539 |
| Minimum | 350 |
|
|
- Mean = 704.955
- Std.dev = 148.255
- 89 items above graph maximum of 1253
- 20 items have value 0 (Measure invalid)
|


