Data
50,080 items of data are available, covering 46,628 participants.
Defined-instances run from 2 to 3, labelled using Instancing
2.
Units of measurement are Std.Devs.
| Maximum | 11.1384 |
| Decile 9 | 1.40521 |
| Decile 8 | 0.794873 |
| Decile 7 | 0.368211 |
| Decile 6 | 0.0242471 |
| Median | -0.298198 |
| Decile 4 | -0.606924 |
| Decile 3 | -0.924023 |
| Decile 2 | -1.29439 |
| Decile 1 | -1.79801 |
| Minimum | -6.93535 |
|
|
- Mean = -0.235345
- Std.dev = 1.2591
- 1 item below graph minimum of -5.00124
- 40 items above graph maximum of 4.60844
|
2 Instances
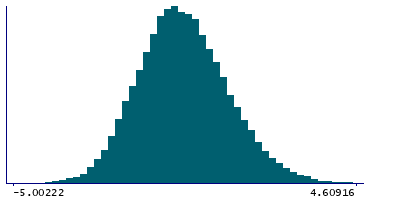
Instance 2 : Imaging visit (2014+)
46,175 participants, 46,175 items
| Maximum | 11.1384 |
| Decile 9 | 1.41536 |
| Decile 8 | 0.80204 |
| Decile 7 | 0.375113 |
| Decile 6 | 0.0304036 |
| Median | -0.291099 |
| Decile 4 | -0.599262 |
| Decile 3 | -0.917871 |
| Decile 2 | -1.28988 |
| Decile 1 | -1.79289 |
| Minimum | -6.93535 |
|

|
- Mean = -0.228452
- Std.dev = 1.26121
- 1 item below graph minimum of -5.00114
- 37 items above graph maximum of 4.62362
|
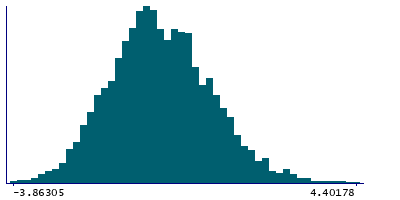
Instance 3 : First repeat imaging visit (2019+)
3,905 participants, 3,905 items
| Maximum | 5.14763 |
| Decile 9 | 1.26846 |
| Decile 8 | 0.708554 |
| Decile 7 | 0.294749 |
| Decile 6 | -0.0427126 |
| Median | -0.385798 |
| Decile 4 | -0.682505 |
| Decile 3 | -0.980735 |
| Decile 2 | -1.3488 |
| Decile 1 | -1.86302 |
| Minimum | -3.86305 |
|
|
- Mean = -0.316861
- Std.dev = 1.23096
- 4 items above graph maximum of 4.39994
|