Data
39,618 items of data are available, covering 37,214 participants.
Defined-instances run from 2 to 3, labelled using Instancing
2.
Units of measurement are g.
| Maximum | 380.057 |
| Decile 9 | 247.215 |
| Decile 8 | 227.054 |
| Decile 7 | 210.818 |
| Decile 6 | 193.245 |
| Median | 170.248 |
| Decile 4 | 150.729 |
| Decile 3 | 138.413 |
| Decile 2 | 127.612 |
| Decile 1 | 115.53 |
| Minimum | 13.1046 |
|
|
- Mean = 177.24
- Std.dev = 51.436
- 1 item above graph maximum of 378.901
|
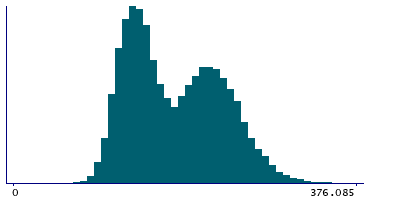
2 Instances
Instance 2 : Imaging visit (2014+)
35,837 participants, 35,837 items
| Maximum | 380.057 |
| Decile 9 | 247.263 |
| Decile 8 | 226.981 |
| Decile 7 | 210.603 |
| Decile 6 | 193.127 |
| Median | 169.933 |
| Decile 4 | 150.647 |
| Decile 3 | 138.345 |
| Decile 2 | 127.597 |
| Decile 1 | 115.616 |
| Minimum | 13.1046 |
|

|
- Mean = 177.158
- Std.dev = 51.4
- 1 item above graph maximum of 378.91
|
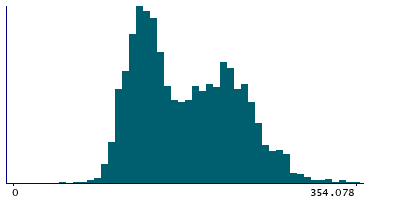
Instance 3 : First repeat imaging visit (2019+)
3,781 participants, 3,781 items
| Maximum | 354.078 |
| Decile 9 | 246.943 |
| Decile 8 | 227.901 |
| Decile 7 | 212.998 |
| Decile 6 | 194.802 |
| Median | 173.277 |
| Decile 4 | 151.273 |
| Decile 3 | 139.072 |
| Decile 2 | 127.786 |
| Decile 1 | 114.434 |
| Minimum | 40.9495 |
|
|
- Mean = 178.019
- Std.dev = 51.769
|