Data
39,618 items of data are available, covering 37,214 participants.
Defined-instances run from 2 to 3, labelled using Instancing
2.
Units of measurement are g/cm2.
| Maximum | 2.31567 |
| Decile 9 | 1.47736 |
| Decile 8 | 1.39812 |
| Decile 7 | 1.33657 |
| Decile 6 | 1.27973 |
| Median | 1.2255 |
| Decile 4 | 1.17132 |
| Decile 3 | 1.11676 |
| Decile 2 | 1.05789 |
| Decile 1 | 0.98453 |
| Minimum | 0.611411 |
|
|
- Mean = 1.22938
- Std.dev = 0.189476
- 4 items above graph maximum of 1.97019
|
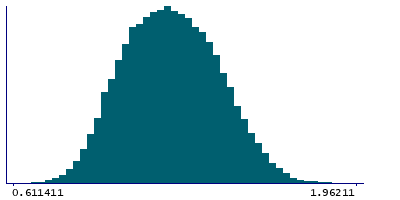
2 Instances
Instance 2 : Imaging visit (2014+)
35,837 participants, 35,837 items
| Maximum | 2.31567 |
| Decile 9 | 1.47718 |
| Decile 8 | 1.39766 |
| Decile 7 | 1.33552 |
| Decile 6 | 1.27895 |
| Median | 1.22522 |
| Decile 4 | 1.17118 |
| Decile 3 | 1.11679 |
| Decile 2 | 1.05813 |
| Decile 1 | 0.984686 |
| Minimum | 0.611411 |
|

|
- Mean = 1.22924
- Std.dev = 0.189395
- 5 items above graph maximum of 1.96967
|
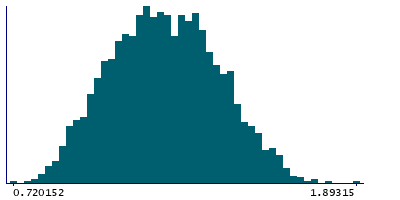
Instance 3 : First repeat imaging visit (2019+)
3,781 participants, 3,781 items
| Maximum | 1.89315 |
| Decile 9 | 1.47939 |
| Decile 8 | 1.40243 |
| Decile 7 | 1.3434 |
| Decile 6 | 1.28831 |
| Median | 1.22899 |
| Decile 4 | 1.17287 |
| Decile 3 | 1.11659 |
| Decile 2 | 1.05605 |
| Decile 1 | 0.982932 |
| Minimum | 0.672688 |
|
|
- Mean = 1.23078
- Std.dev = 0.190244
|