Data
39,618 items of data are available, covering 37,214 participants.
Defined-instances run from 2 to 3, labelled using Instancing
2.
Units of measurement are g/cm2.
| Maximum | 1.9292 |
| Decile 9 | 1.38019 |
| Decile 8 | 1.31476 |
| Decile 7 | 1.26652 |
| Decile 6 | 1.22324 |
| Median | 1.18263 |
| Decile 4 | 1.13901 |
| Decile 3 | 1.09265 |
| Decile 2 | 1.04116 |
| Decile 1 | 0.976351 |
| Minimum | 0.619356 |
|

|
- Mean = 1.18047
- Std.dev = 0.155141
- 6 items above graph maximum of 1.78403
|
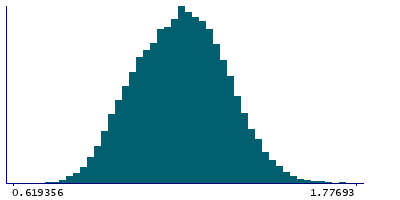
2 Instances
Instance 2 : Imaging visit (2014+)
35,837 participants, 35,837 items
| Maximum | 1.9292 |
| Decile 9 | 1.38023 |
| Decile 8 | 1.31518 |
| Decile 7 | 1.26676 |
| Decile 6 | 1.22337 |
| Median | 1.18292 |
| Decile 4 | 1.1394 |
| Decile 3 | 1.09332 |
| Decile 2 | 1.04165 |
| Decile 1 | 0.976853 |
| Minimum | 0.619356 |
|
|
- Mean = 1.18085
- Std.dev = 0.155215
- 6 items above graph maximum of 1.7836
|
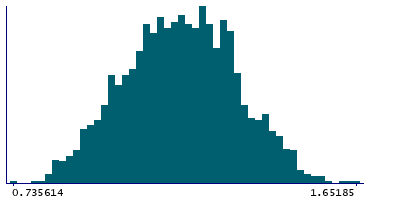
Instance 3 : First repeat imaging visit (2019+)
3,781 participants, 3,781 items
| Maximum | 1.71908 |
| Decile 9 | 1.37916 |
| Decile 8 | 1.31098 |
| Decile 7 | 1.26465 |
| Decile 6 | 1.22147 |
| Median | 1.18015 |
| Decile 4 | 1.13522 |
| Decile 3 | 1.08809 |
| Decile 2 | 1.03752 |
| Decile 1 | 0.973237 |
| Minimum | 0.724467 |
|
|
- Mean = 1.1769
- Std.dev = 0.154387
|