Data
78,150 items of data are available, covering 72,120 participants.
Defined-instances run from 2 to 3, labelled using Instancing
2.
Units of measurement are g/cm2.
| Maximum | 2.29456 |
| Decile 9 | 1.19371 |
| Decile 8 | 1.11719 |
| Decile 7 | 1.06341 |
| Decile 6 | 1.01746 |
| Median | 0.976017 |
| Decile 4 | 0.935262 |
| Decile 3 | 0.892241 |
| Decile 2 | 0.844461 |
| Decile 1 | 0.782871 |
| Minimum | 0 |
|
|
- Mean = 0.983471
- Std.dev = 0.160182
- 31 items above graph maximum of 1.60455
|
2 Instances
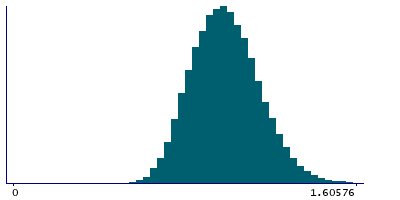
Instance 2 : Imaging visit (2014+)
71,842 participants, 71,842 items
| Maximum | 2.29456 |
| Decile 9 | 1.19431 |
| Decile 8 | 1.11756 |
| Decile 7 | 1.06379 |
| Decile 6 | 1.01753 |
| Median | 0.97612 |
| Decile 4 | 0.935331 |
| Decile 3 | 0.892267 |
| Decile 2 | 0.844601 |
| Decile 1 | 0.783325 |
| Minimum | 0 |
|

|
- Mean = 0.983682
- Std.dev = 0.160415
- 30 items above graph maximum of 1.60529
|
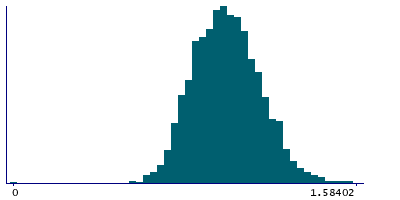
Instance 3 : First repeat imaging visit (2019+)
6,308 participants, 6,308 items
| Maximum | 1.72116 |
| Decile 9 | 1.18869 |
| Decile 8 | 1.11338 |
| Decile 7 | 1.05943 |
| Decile 6 | 1.0165 |
| Median | 0.975152 |
| Decile 4 | 0.934546 |
| Decile 3 | 0.891592 |
| Decile 2 | 0.84288 |
| Decile 1 | 0.779592 |
| Minimum | 0 |
|
|
- Mean = 0.981077
- Std.dev = 0.15748
- 2 items above graph maximum of 1.59779
|