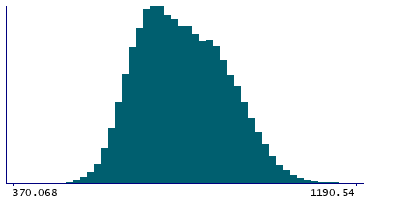
Data
78,765 items of data are available, covering 72,674 participants.
Defined-instances run from 2 to 3, labelled using Instancing
2.
Units of measurement are cm2.
| Maximum | 2717.27 |
| Decile 9 | 914.798 |
| Decile 8 | 867.2 |
| Decile 7 | 830.556 |
| Decile 6 | 796.132 |
| Median | 763.175 |
| Decile 4 | 732.746 |
| Decile 3 | 704.1 |
| Decile 2 | 674.99 |
| Decile 1 | 638.901 |
| Minimum | 0 |
|
|
- Mean = 770.9
- Std.dev = 106.956
- 14 items below graph minimum of 363.004
- 6 items above graph maximum of 1190.7
|
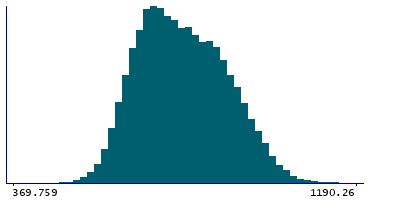
2 Instances
Instance 2 : Imaging visit (2014+)
72,404 participants, 72,404 items
| Maximum | 2717.27 |
| Decile 9 | 914.58 |
| Decile 8 | 866.951 |
| Decile 7 | 830.205 |
| Decile 6 | 795.674 |
| Median | 762.669 |
| Decile 4 | 732.187 |
| Decile 3 | 703.703 |
| Decile 2 | 674.623 |
| Decile 1 | 638.611 |
| Minimum | 0 |
|
|
- Mean = 770.517
- Std.dev = 106.978
- 13 items below graph minimum of 362.642
- 5 items above graph maximum of 1190.55
|
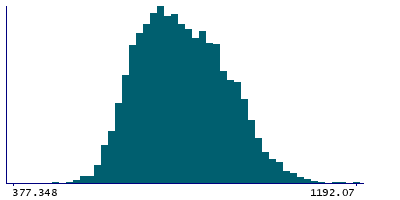
Instance 3 : First repeat imaging visit (2019+)
6,361 participants, 6,361 items
| Maximum | 1231.68 |
| Decile 9 | 918.694 |
| Decile 8 | 870.041 |
| Decile 7 | 834.623 |
| Decile 6 | 801.268 |
| Median | 768.714 |
| Decile 4 | 738.66 |
| Decile 3 | 709.382 |
| Decile 2 | 679.369 |
| Decile 1 | 641.933 |
| Minimum | 0 |
|
|
- Mean = 775.266
- Std.dev = 106.599
- 1 item below graph minimum of 365.172
- 1 item above graph maximum of 1195.45
|