Data
50,740 items of data are available, covering 47,036 participants.
Defined-instances run from 2 to 3, labelled using Instancing
2.
Units of measurement are fraction.
| Maximum | 40.5048 |
| Decile 9 | 9.1587 |
| Decile 8 | 5.736 |
| Decile 7 | 4.2293 |
| Decile 6 | 3.4265 |
| Median | 2.893 |
| Decile 4 | 2.5053 |
| Decile 3 | 2.1768 |
| Decile 2 | 1.87553 |
| Decile 1 | 1.55218 |
| Minimum | -0.5194 |
|

|
- Mean = 4.34202
- Std.dev = 4.03253
- 1216 items above graph maximum of 16.7652
|
2 Instances
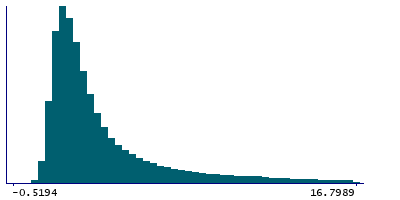
Instance 2 : Imaging visit (2014+)
46,854 participants, 46,854 items
| Maximum | 40.5048 |
| Decile 9 | 9.17445 |
| Decile 8 | 5.7539 |
| Decile 7 | 4.23704 |
| Decile 6 | 3.4305 |
| Median | 2.8936 |
| Decile 4 | 2.5037 |
| Decile 3 | 2.17585 |
| Decile 2 | 1.87227 |
| Decile 1 | 1.5502 |
| Minimum | -0.5194 |
|
|
- Mean = 4.34628
- Std.dev = 4.03851
- 1122 items above graph maximum of 16.7987
|
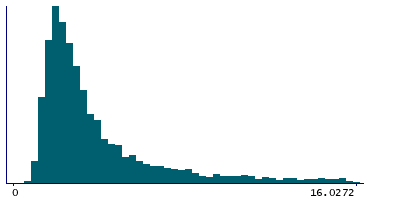
Instance 3 : First repeat imaging visit (2019+)
3,886 participants, 3,886 items
| Maximum | 34.908 |
| Decile 9 | 8.80862 |
| Decile 8 | 5.57808 |
| Decile 7 | 4.14721 |
| Decile 6 | 3.38095 |
| Median | 2.88556 |
| Decile 4 | 2.52162 |
| Decile 3 | 2.18603 |
| Decile 2 | 1.9038 |
| Decile 1 | 1.59 |
| Minimum | 0.373751 |
|
|
- Mean = 4.29071
- Std.dev = 3.9594
- 98 items above graph maximum of 16.0272
|
Notes
Fat referenced (FR) liver proton density fat fraction (PDFF) measured as the average PDFF in up to nine (and at least three) regions of interest (ROI) in the liver. These ROI avoid inhomogeneities, major vessels, and bile ducts. These values were derived based on the IDEAL imaging protocol (
Field 20254).
0 Related Data-Fields
There are no related data-fields
1 Application
| Application ID | Title |
|---|
| 23889 | Volumetric measurements of body composition and their distribution across data-driven categories of health, lifestyle and well-being |

