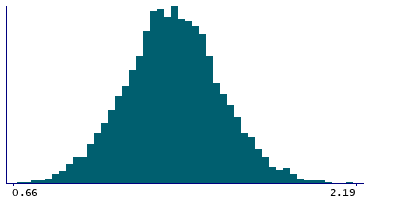
Data
8,865 items of data are available, covering 8,865 participants.
Defined-instances run from 2 to 3, labelled using Instancing
2.
| Maximum | 2.79 |
| Decile 9 | 1.64 |
| Decile 8 | 1.54 |
| Decile 7 | 1.48 |
| Decile 6 | 1.42 |
| Median | 1.37 |
| Decile 4 | 1.32 |
| Decile 3 | 1.27 |
| Decile 2 | 1.2 |
| Decile 1 | 1.11 |
| Minimum | 0.66 |
|
|
- Mean = 1.37279
- Std.dev = 0.210794
- 10 items above graph maximum of 2.17
|
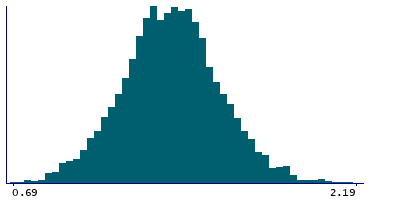
2 Instances
Instance 2 : Imaging visit (2014+)
7,066 participants, 7,066 items
| Maximum | 2.79 |
| Decile 9 | 1.64 |
| Decile 8 | 1.54 |
| Decile 7 | 1.48 |
| Decile 6 | 1.43 |
| Median | 1.38 |
| Decile 4 | 1.32 |
| Decile 3 | 1.27 |
| Decile 2 | 1.21 |
| Decile 1 | 1.12 |
| Minimum | 0.68 |
|
|
- Mean = 1.37841
- Std.dev = 0.209109
- 7 items above graph maximum of 2.16
|
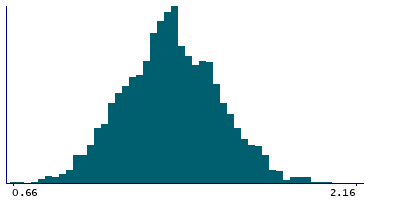
Instance 3 : First repeat imaging visit (2019+)
1,799 participants, 1,799 items
| Maximum | 2.73 |
| Decile 9 | 1.62 |
| Decile 8 | 1.53 |
| Decile 7 | 1.46 |
| Decile 6 | 1.39 |
| Median | 1.35 |
| Decile 4 | 1.3 |
| Decile 3 | 1.24 |
| Decile 2 | 1.17 |
| Decile 1 | 1.08 |
| Minimum | 0.66 |
|
|
- Mean = 1.35071
- Std.dev = 0.215874
- 3 items above graph maximum of 2.16
|
Notes
Precision-weighted mean ATT (arterial transit time) in the left Cerebellum in voxels with >70% grey matter partial volume
0 Related Data-Fields
There are no related data-fields


