Data
92,884 items of data are available, covering 87,671 participants.
Defined-instances run from 2 to 3, labelled using Instancing
2.
| Maximum | 6.95699 |
| Decile 9 | 0.563065 |
| Decile 8 | 0.476372 |
| Decile 7 | 0.421163 |
| Decile 6 | 0.379194 |
| Median | 0.343712 |
| Decile 4 | 0.310417 |
| Decile 3 | 0.277582 |
| Decile 2 | 0.241894 |
| Decile 1 | 0.195226 |
| Minimum | -1.86047 |
|
|
- Mean = 0.367153
- Std.dev = 0.169107
- 8 items below graph minimum of -0.172613
- 677 items above graph maximum of 0.930903
|
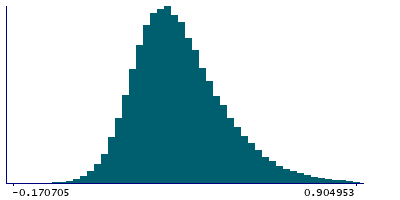
2 Instances
Instance 2 : Imaging visit (2014+)
87,670 participants, 87,670 items
| Maximum | 6.95699 |
| Decile 9 | 0.564686 |
| Decile 8 | 0.477766 |
| Decile 7 | 0.42196 |
| Decile 6 | 0.379906 |
| Median | 0.344114 |
| Decile 4 | 0.310586 |
| Decile 3 | 0.27739 |
| Decile 2 | 0.241554 |
| Decile 1 | 0.194305 |
| Minimum | -1.86047 |
|

|
- Mean = 0.367729
- Std.dev = 0.170893
- 7 items below graph minimum of -0.176076
- 651 items above graph maximum of 0.935068
|
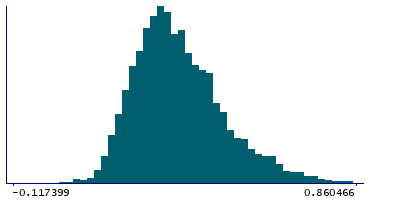
Instance 3 : First repeat imaging visit (2019+)
5,214 participants, 5,214 items
| Maximum | 1.46035 |
| Decile 9 | 0.534511 |
| Decile 8 | 0.453602 |
| Decile 7 | 0.408867 |
| Decile 6 | 0.370101 |
| Median | 0.336827 |
| Decile 4 | 0.308037 |
| Decile 3 | 0.280024 |
| Decile 2 | 0.248776 |
| Decile 1 | 0.208556 |
| Minimum | -0.387153 |
|
|
- Mean = 0.357468
- Std.dev = 0.135235
- 2 items below graph minimum of -0.117399
- 21 items above graph maximum of 0.860466
|
Notes
Measure of head motion in T1 structural image
0 Related Data-Fields
There are no related data-fields