Data
90,187 items of data are available, covering 85,098 participants.
Defined-instances run from 2 to 3, labelled using Instancing
2.
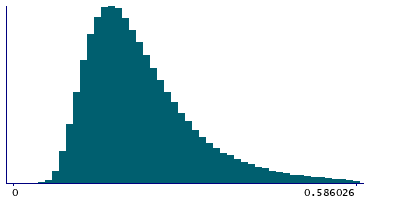
| Maximum | 3.68235 |
| Decile 9 | 0.359433 |
| Decile 8 | 0.291977 |
| Decile 7 | 0.253406 |
| Decile 6 | 0.225372 |
| Median | 0.202667 |
| Decile 4 | 0.18275 |
| Decile 3 | 0.164045 |
| Decile 2 | 0.145007 |
| Decile 1 | 0.122724 |
| Minimum | 0.0436971 |
|
|
- Mean = 0.227947
- Std.dev = 0.112682
- 1124 items above graph maximum of 0.596143
|
2 Instances
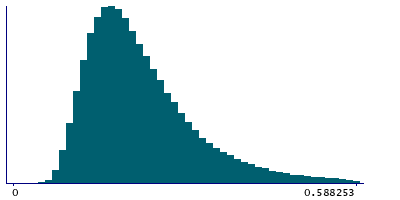
Instance 2 : Imaging visit (2014+)
85,002 participants, 85,002 items
| Maximum | 3.68235 |
| Decile 9 | 0.360578 |
| Decile 8 | 0.292894 |
| Decile 7 | 0.254119 |
| Decile 6 | 0.226059 |
| Median | 0.203111 |
| Decile 4 | 0.183134 |
| Decile 3 | 0.164305 |
| Decile 2 | 0.145199 |
| Decile 1 | 0.122903 |
| Minimum | 0.0436971 |
|
|
- Mean = 0.22859
- Std.dev = 0.113428
- 1075 items above graph maximum of 0.598253
|
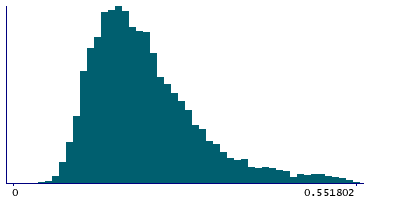
Instance 3 : First repeat imaging visit (2019+)
5,185 participants, 5,185 items
| Maximum | 1.2639 |
| Decile 9 | 0.335974 |
| Decile 8 | 0.276108 |
| Decile 7 | 0.242151 |
| Decile 6 | 0.216657 |
| Median | 0.196084 |
| Decile 4 | 0.177355 |
| Decile 3 | 0.159822 |
| Decile 2 | 0.142129 |
| Decile 1 | 0.120146 |
| Minimum | 0.0444635 |
|
|
- Mean = 0.217418
- Std.dev = 0.0990653
- 57 items above graph maximum of 0.551802
|
Notes
90th percentile of the relative head motion from rfMRI calculated by FEAT
0 Related Data-Fields
There are no related data-fields


