Data
90,186 items of data are available, covering 85,097 participants.
Defined-instances run from 2 to 3, labelled using Instancing
2.
| Maximum | 0.568404 |
| Decile 9 | 0.0583125 |
| Decile 8 | 0.0452165 |
| Decile 7 | 0.0381888 |
| Decile 6 | 0.0332049 |
| Median | 0.02932 |
| Decile 4 | 0.0258957 |
| Decile 3 | 0.0227125 |
| Decile 2 | 0.0195439 |
| Decile 1 | 0.0158273 |
| Minimum | 0.00454059 |
|

|
- Mean = 0.0343603
- Std.dev = 0.0206906
- 1294 items above graph maximum of 0.100798
|
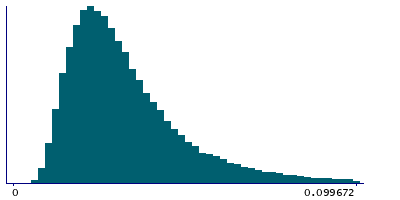
2 Instances
Instance 2 : Imaging visit (2014+)
85,001 participants, 85,001 items
| Maximum | 0.568404 |
| Decile 9 | 0.0583917 |
| Decile 8 | 0.0452423 |
| Decile 7 | 0.0382265 |
| Decile 6 | 0.0332117 |
| Median | 0.0293171 |
| Decile 4 | 0.0258838 |
| Decile 3 | 0.0226821 |
| Decile 2 | 0.0195232 |
| Decile 1 | 0.0158069 |
| Minimum | 0.00454059 |
|
|
- Mean = 0.0343817
- Std.dev = 0.020786
- 1228 items above graph maximum of 0.100977
|
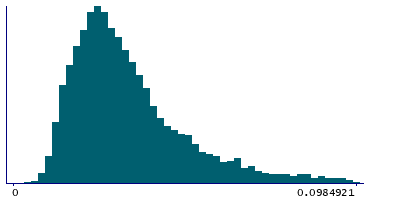
Instance 3 : First repeat imaging visit (2019+)
5,185 participants, 5,185 items
| Maximum | 0.216096 |
| Decile 9 | 0.0573541 |
| Decile 8 | 0.0448705 |
| Decile 7 | 0.0376376 |
| Decile 6 | 0.0330464 |
| Median | 0.0293582 |
| Decile 4 | 0.0261494 |
| Decile 3 | 0.0230955 |
| Decile 2 | 0.0200105 |
| Decile 1 | 0.016216 |
| Minimum | 0.00484068 |
|
|
- Mean = 0.0340106
- Std.dev = 0.0190551
- 62 items above graph maximum of 0.0984921
|
Notes
90th percentile (across space) of the mean (across time) of Z displacement from rfMRI
0 Related Data-Fields
There are no related data-fields


