Data
77,958 items of data are available, covering 73,705 participants.
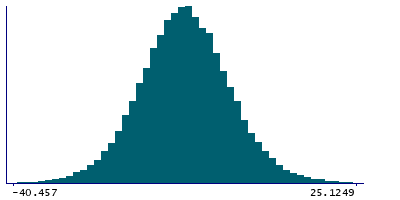
Defined-instances run from 2 to 3, labelled using Instancing
2.
| Maximum | 73.6299 |
| Decile 9 | 3.54646 |
| Decile 8 | -0.396142 |
| Decile 7 | -3.11277 |
| Decile 6 | -5.44458 |
| Median | -7.56327 |
| Decile 4 | -9.67334 |
| Decile 3 | -11.9348 |
| Decile 2 | -14.6202 |
| Decile 1 | -18.5024 |
| Minimum | -60.2021 |
|
|
- Mean = -7.49684
- Std.dev = 9.00668
- 80 items below graph minimum of -40.5513
- 110 items above graph maximum of 25.5953
|
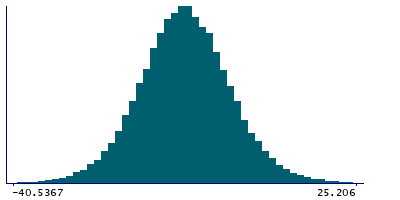
2 Instances
Instance 2 : Imaging visit (2014+)
73,327 participants, 73,327 items
| Maximum | 73.6299 |
| Decile 9 | 3.5821 |
| Decile 8 | -0.357796 |
| Decile 7 | -3.07691 |
| Decile 6 | -5.41254 |
| Median | -7.54856 |
| Decile 4 | -9.66353 |
| Decile 3 | -11.9289 |
| Decile 2 | -14.6133 |
| Decile 1 | -18.5118 |
| Minimum | -60.2021 |
|
|
- Mean = -7.475
- Std.dev = 9.02879
- 76 items below graph minimum of -40.6058
- 103 items above graph maximum of 25.676
|
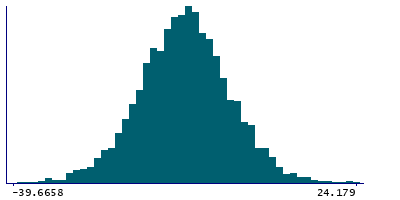
Instance 3 : First repeat imaging visit (2019+)
4,631 participants, 4,631 items
| Maximum | 37.5742 |
| Decile 9 | 2.88365 |
| Decile 8 | -0.992088 |
| Decile 7 | -3.605 |
| Decile 6 | -5.89221 |
| Median | -7.78276 |
| Decile 4 | -9.8441 |
| Decile 3 | -12.08 |
| Decile 2 | -14.7571 |
| Decile 1 | -18.3842 |
| Minimum | -49.7555 |
|
|
- Mean = -7.84265
- Std.dev = 8.64164
- 5 items below graph minimum of -39.6521
- 4 items above graph maximum of 24.1515
|
Notes
Median magnetic susceptibility in right amygdala (from QSM processing of SWI data)
0 Related Data-Fields
There are no related data-fields


