Data
77,955 items of data are available, covering 73,702 participants.
Defined-instances run from 2 to 3, labelled using Instancing
2.
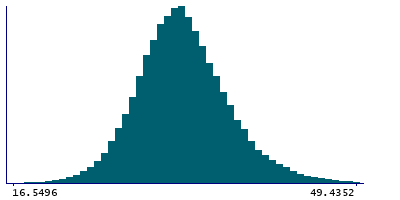
| Maximum | 56.5488 |
| Decile 9 | 38.6445 |
| Decile 8 | 36.3575 |
| Decile 7 | 34.8631 |
| Decile 6 | 33.6667 |
| Median | 32.6328 |
| Decile 4 | 31.6233 |
| Decile 3 | 30.5494 |
| Decile 2 | 29.3055 |
| Decile 1 | 27.5141 |
| Minimum | 0 |
|
|
- Mean = 32.9046
- Std.dev = 4.53366
- 28 items below graph minimum of 16.3836
- 105 items above graph maximum of 49.775
|
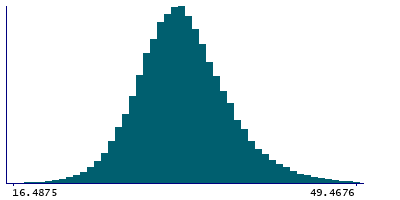
2 Instances
Instance 2 : Imaging visit (2014+)
73,324 participants, 73,324 items
| Maximum | 56.5488 |
| Decile 9 | 38.6536 |
| Decile 8 | 36.3696 |
| Decile 7 | 34.8683 |
| Decile 6 | 33.6689 |
| Median | 32.6253 |
| Decile 4 | 31.6088 |
| Decile 3 | 30.5373 |
| Decile 2 | 29.2854 |
| Decile 1 | 27.4921 |
| Minimum | 0 |
|
|
- Mean = 32.8992
- Std.dev = 4.54528
- 25 items below graph minimum of 16.3306
- 97 items above graph maximum of 49.8151
|
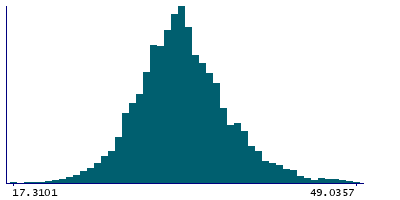
Instance 3 : First repeat imaging visit (2019+)
4,631 participants, 4,631 items
| Maximum | 56.3681 |
| Decile 9 | 38.4605 |
| Decile 8 | 36.1578 |
| Decile 7 | 34.8015 |
| Decile 6 | 33.6233 |
| Median | 32.7164 |
| Decile 4 | 31.8131 |
| Decile 3 | 30.7912 |
| Decile 2 | 29.6433 |
| Decile 1 | 27.8853 |
| Minimum | 10.6284 |
|
|
- Mean = 32.9902
- Std.dev = 4.34453
- 3 items below graph minimum of 17.3101
- 10 items above graph maximum of 49.0357
|
Notes
Median T2star in right substantia nigra (from SWI data)
0 Related Data-Fields
There are no related data-fields


