Data
86,657 items of data are available, covering 82,012 participants.
Defined-instances run from 2 to 3, labelled using Instancing
2.
Units of measurement are mm3.
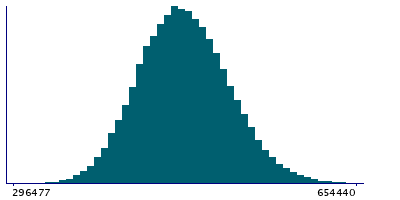
| Maximum | 717685 |
| Decile 9 | 532130 |
| Decile 8 | 510119 |
| Decile 7 | 494586 |
| Decile 6 | 481289 |
| Median | 469123 |
| Decile 4 | 457320 |
| Decile 3 | 444625 |
| Decile 2 | 430557 |
| Decile 1 | 411423 |
| Minimum | 287876 |
|
|
- Mean = 470738
- Std.dev = 47062
- 1 item below graph minimum of 290716
- 18 items above graph maximum of 652836
|
2 Instances
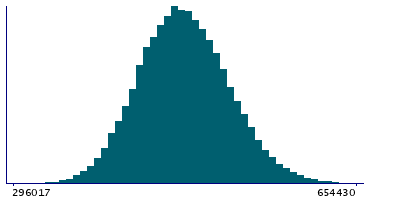
Instance 2 : Imaging visit (2014+)
81,876 participants, 81,876 items
| Maximum | 717685 |
| Decile 9 | 531861 |
| Decile 8 | 509744 |
| Decile 7 | 494175 |
| Decile 6 | 480870 |
| Median | 468723 |
| Decile 4 | 456929 |
| Decile 3 | 444245 |
| Decile 2 | 430118 |
| Decile 1 | 410967 |
| Minimum | 287876 |
|
|
- Mean = 470345
- Std.dev = 47082.1
- 1 item below graph minimum of 290074
- 17 items above graph maximum of 652754
|
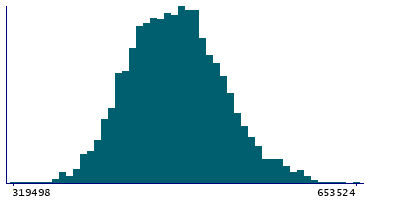
Instance 3 : First repeat imaging visit (2019+)
4,781 participants, 4,781 items
| Maximum | 653524 |
| Decile 9 | 536939 |
| Decile 8 | 516179 |
| Decile 7 | 500298 |
| Decile 6 | 488020 |
| Median | 476116 |
| Decile 4 | 463837 |
| Decile 3 | 451024 |
| Decile 2 | 437667 |
| Decile 1 | 419817 |
| Minimum | 319498 |
|
|
- Mean = 477473
- Std.dev = 46198.8
|
Notes
Volume of peripheral cortical grey matter (from T1 brain image)
0 Related Data-Fields
There are no related data-fields
2 Applications
| Application ID | Title |
|---|
| 17689 | Genetic, environmental and lifestyle predictors of brain/cognitive-related outcomes. |
| 22783 | The joint analysis of imaging data and genetic data for early tumor detection, prevention, diagnosis and treatment |


