Data
78,625 items of data are available, covering 74,332 participants.
Defined-instances run from 2 to 3, labelled using Instancing
2.
Units of measurement are ms.
| Maximum | 52.1758 |
| Decile 9 | 33.0335 |
| Decile 8 | 31.3975 |
| Decile 7 | 30.2848 |
| Decile 6 | 29.3479 |
| Median | 28.5054 |
| Decile 4 | 27.6685 |
| Decile 3 | 26.796 |
| Decile 2 | 25.7505 |
| Decile 1 | 24.2842 |
| Minimum | 0 |
|
|
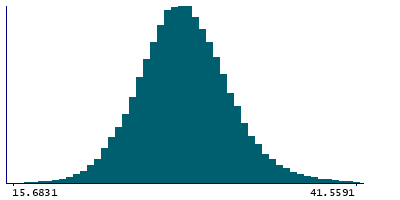
- Mean = 28.6314
- Std.dev = 3.60051
- 19 items below graph minimum of 15.535
- 208 items above graph maximum of 41.7828
|
2 Instances
Instance 2 : Imaging visit (2014+)
73,987 participants, 73,987 items
| Maximum | 52.1758 |
| Decile 9 | 33.0318 |
| Decile 8 | 31.3936 |
| Decile 7 | 30.2839 |
| Decile 6 | 29.3447 |
| Median | 28.5029 |
| Decile 4 | 27.6632 |
| Decile 3 | 26.7908 |
| Decile 2 | 25.7408 |
| Decile 1 | 24.2749 |
| Minimum | 0 |
|

|
- Mean = 28.6263
- Std.dev = 3.60503
- 18 items below graph minimum of 15.518
- 200 items above graph maximum of 41.7888
|
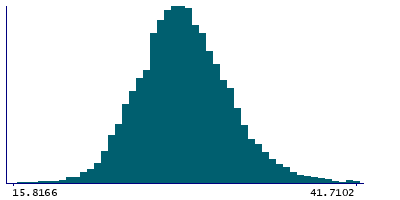
Instance 3 : First repeat imaging visit (2019+)
4,638 participants, 4,638 items
| Maximum | 47.3154 |
| Decile 9 | 33.0802 |
| Decile 8 | 31.4632 |
| Decile 7 | 30.3179 |
| Decile 6 | 29.3832 |
| Median | 28.548 |
| Decile 4 | 27.7388 |
| Decile 3 | 26.8783 |
| Decile 2 | 25.8958 |
| Decile 1 | 24.4465 |
| Minimum | 0 |
|
|
- Mean = 28.714
- Std.dev = 3.52659
- 2 items below graph minimum of 15.8128
- 7 items above graph maximum of 41.7138
|
Notes
Median T2star in right pallidum (from SWI data)
0 Related Data-Fields
There are no related data-fields
2 Applications
| Application ID | Title |
|---|
| 17689 | Genetic, environmental and lifestyle predictors of brain/cognitive-related outcomes. |
| 22783 | The joint analysis of imaging data and genetic data for early tumor detection, prevention, diagnosis and treatment |


