Data
83,911 items of data are available, covering 79,384 participants.
Defined-instances run from 2 to 3, labelled using Instancing
2.
Units of measurement are AU.
| Maximum | 0.875997 |
| Decile 9 | 0.81547 |
| Decile 8 | 0.807234 |
| Decile 7 | 0.801145 |
| Decile 6 | 0.795833 |
| Median | 0.790668 |
| Decile 4 | 0.785315 |
| Decile 3 | 0.779401 |
| Decile 2 | 0.772037 |
| Decile 1 | 0.760958 |
| Minimum | 0.184025 |
|
|
- Mean = 0.788802
- Std.dev = 0.0232321
- 418 items below graph minimum of 0.706446
- 1 item above graph maximum of 0.869983
|
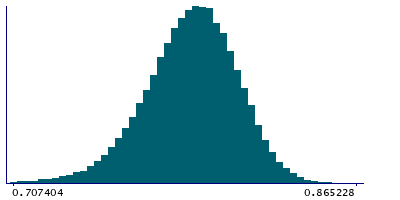
2 Instances
Instance 2 : Imaging visit (2014+)
79,153 participants, 79,153 items
| Maximum | 0.875997 |
| Decile 9 | 0.815479 |
| Decile 8 | 0.807269 |
| Decile 7 | 0.801173 |
| Decile 6 | 0.795866 |
| Median | 0.790693 |
| Decile 4 | 0.78529 |
| Decile 3 | 0.77934 |
| Decile 2 | 0.771936 |
| Decile 1 | 0.760819 |
| Minimum | 0.184025 |
|

|
- Mean = 0.788763
- Std.dev = 0.0233313
- 395 items below graph minimum of 0.70616
- 1 item above graph maximum of 0.870138
|
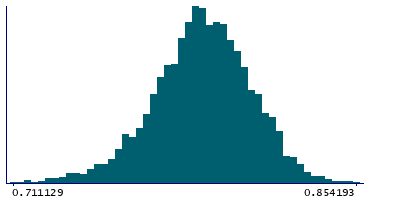
Instance 3 : First repeat imaging visit (2019+)
4,758 participants, 4,758 items
| Maximum | 0.854193 |
| Decile 9 | 0.815394 |
| Decile 8 | 0.806717 |
| Decile 7 | 0.800594 |
| Decile 6 | 0.795412 |
| Median | 0.790279 |
| Decile 4 | 0.785716 |
| Decile 3 | 0.780326 |
| Decile 2 | 0.773535 |
| Decile 1 | 0.763268 |
| Minimum | 0.566926 |
|
|
- Mean = 0.789451
- Std.dev = 0.021505
- 14 items below graph minimum of 0.711142
|
Notes
Mean FA (fractional anisotropy) in splenium of corpus callosum on FA skeleton (from dMRI data)
0 Related Data-Fields
There are no related data-fields
2 Applications
| Application ID | Title |
|---|
| 17689 | Genetic, environmental and lifestyle predictors of brain/cognitive-related outcomes. |
| 22783 | The joint analysis of imaging data and genetic data for early tumor detection, prevention, diagnosis and treatment |

