Data
83,911 items of data are available, covering 79,384 participants.
Defined-instances run from 2 to 3, labelled using Instancing
2.
Units of measurement are AU.
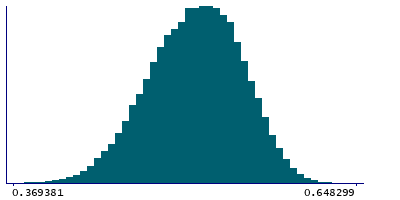
| Maximum | 0.648299 |
| Decile 9 | 0.56386 |
| Decile 8 | 0.549125 |
| Decile 7 | 0.53814 |
| Decile 6 | 0.52802 |
| Median | 0.51795 |
| Decile 4 | 0.507775 |
| Decile 3 | 0.496502 |
| Decile 2 | 0.483678 |
| Decile 1 | 0.466097 |
| Minimum | 0 |
|
|
- Mean = 0.516116
- Std.dev = 0.0380694
- 47 items below graph minimum of 0.368333
|
2 Instances
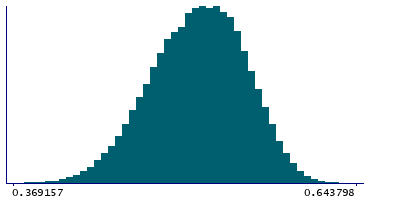
Instance 2 : Imaging visit (2014+)
79,153 participants, 79,153 items
| Maximum | 0.643798 |
| Decile 9 | 0.563713 |
| Decile 8 | 0.549019 |
| Decile 7 | 0.538031 |
| Decile 6 | 0.527907 |
| Median | 0.517831 |
| Decile 4 | 0.507648 |
| Decile 3 | 0.496358 |
| Decile 2 | 0.483508 |
| Decile 1 | 0.465902 |
| Minimum | 0 |
|
|
- Mean = 0.515978
- Std.dev = 0.0381038
- 43 items below graph minimum of 0.368091
|
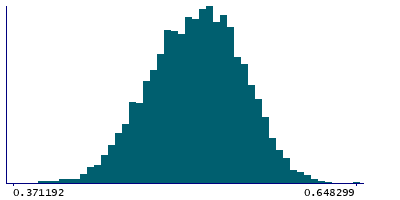
Instance 3 : First repeat imaging visit (2019+)
4,758 participants, 4,758 items
| Maximum | 0.648299 |
| Decile 9 | 0.565899 |
| Decile 8 | 0.550682 |
| Decile 7 | 0.540348 |
| Decile 6 | 0.529873 |
| Median | 0.520132 |
| Decile 4 | 0.509938 |
| Decile 3 | 0.498374 |
| Decile 2 | 0.486442 |
| Decile 1 | 0.468571 |
| Minimum | 0.330924 |
|
|
- Mean = 0.518421
- Std.dev = 0.0374159
- 4 items below graph minimum of 0.371244
|
Notes
Mean FA (fractional anisotropy) in corticospinal tract (right) on FA skeleton (from dMRI data)
0 Related Data-Fields
There are no related data-fields
2 Applications
| Application ID | Title |
|---|
| 17689 | Genetic, environmental and lifestyle predictors of brain/cognitive-related outcomes. |
| 22783 | The joint analysis of imaging data and genetic data for early tumor detection, prevention, diagnosis and treatment |

