Data
83,911 items of data are available, covering 79,384 participants.
Defined-instances run from 2 to 3, labelled using Instancing
2.
Units of measurement are AU.
| Maximum | 0.794733 |
| Decile 9 | 0.739861 |
| Decile 8 | 0.730286 |
| Decile 7 | 0.723145 |
| Decile 6 | 0.71687 |
| Median | 0.710889 |
| Decile 4 | 0.704671 |
| Decile 3 | 0.697944 |
| Decile 2 | 0.68978 |
| Decile 1 | 0.677919 |
| Minimum | 0 |
|

|
- Mean = 0.709349
- Std.dev = 0.0262484
- 250 items below graph minimum of 0.615977
|
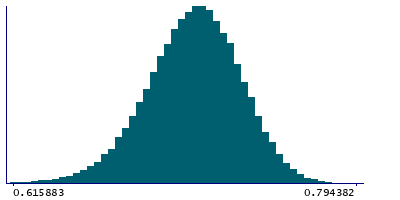
2 Instances
Instance 2 : Imaging visit (2014+)
79,153 participants, 79,153 items
| Maximum | 0.794733 |
| Decile 9 | 0.739839 |
| Decile 8 | 0.730233 |
| Decile 7 | 0.723072 |
| Decile 6 | 0.716783 |
| Median | 0.710819 |
| Decile 4 | 0.704601 |
| Decile 3 | 0.697825 |
| Decile 2 | 0.689688 |
| Decile 1 | 0.677792 |
| Minimum | 0 |
|
|
- Mean = 0.709252
- Std.dev = 0.026367
- 240 items below graph minimum of 0.615745
|
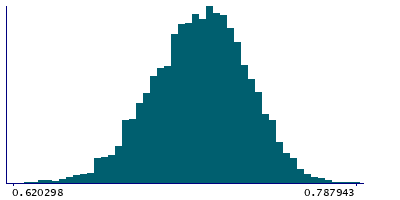
Instance 3 : First repeat imaging visit (2019+)
4,758 participants, 4,758 items
| Maximum | 0.787943 |
| Decile 9 | 0.740356 |
| Decile 8 | 0.730857 |
| Decile 7 | 0.724158 |
| Decile 6 | 0.718106 |
| Median | 0.712124 |
| Decile 4 | 0.706045 |
| Decile 3 | 0.699554 |
| Decile 2 | 0.691299 |
| Decile 1 | 0.680316 |
| Minimum | 0.497036 |
|
|
- Mean = 0.71095
- Std.dev = 0.0241341
- 11 items below graph minimum of 0.620277
|
Notes
Mean FA (fractional anisotropy) in superior cerebellar peduncle (left) on FA skeleton (from dMRI data)
0 Related Data-Fields
There are no related data-fields
2 Applications
| Application ID | Title |
|---|
| 17689 | Genetic, environmental and lifestyle predictors of brain/cognitive-related outcomes. |
| 22783 | The joint analysis of imaging data and genetic data for early tumor detection, prevention, diagnosis and treatment |

