Data
83,911 items of data are available, covering 79,384 participants.
Defined-instances run from 2 to 3, labelled using Instancing
2.
Units of measurement are AU.
| Maximum | 0.797184 |
| Decile 9 | 0.734801 |
| Decile 8 | 0.725637 |
| Decile 7 | 0.718854 |
| Decile 6 | 0.713091 |
| Median | 0.707537 |
| Decile 4 | 0.701783 |
| Decile 3 | 0.695486 |
| Decile 2 | 0.687858 |
| Decile 1 | 0.676865 |
| Minimum | 0 |
|

|
- Mean = 0.706426
- Std.dev = 0.023547
- 92 items below graph minimum of 0.618929
- 1 item above graph maximum of 0.792738
|
2 Instances
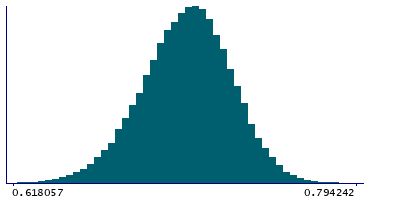
Instance 2 : Imaging visit (2014+)
79,153 participants, 79,153 items
| Maximum | 0.797184 |
| Decile 9 | 0.734795 |
| Decile 8 | 0.725595 |
| Decile 7 | 0.718803 |
| Decile 6 | 0.71301 |
| Median | 0.707429 |
| Decile 4 | 0.701655 |
| Decile 3 | 0.695361 |
| Decile 2 | 0.687714 |
| Decile 1 | 0.676678 |
| Minimum | 0 |
|
|
- Mean = 0.706318
- Std.dev = 0.0236413
- 90 items below graph minimum of 0.618561
- 1 item above graph maximum of 0.792912
|
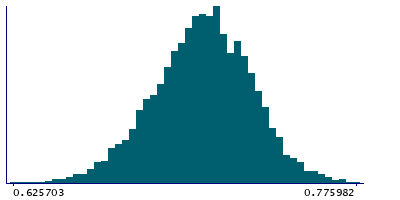
Instance 3 : First repeat imaging visit (2019+)
4,758 participants, 4,758 items
| Maximum | 0.775982 |
| Decile 9 | 0.734963 |
| Decile 8 | 0.726544 |
| Decile 7 | 0.720006 |
| Decile 6 | 0.714366 |
| Median | 0.709111 |
| Decile 4 | 0.703924 |
| Decile 3 | 0.697839 |
| Decile 2 | 0.690546 |
| Decile 1 | 0.680335 |
| Minimum | 0.571865 |
|
|
- Mean = 0.708224
- Std.dev = 0.0218399
- 7 items below graph minimum of 0.625707
|
Notes
Mean FA (fractional anisotropy) in cerebral peduncle (right) on FA skeleton (from dMRI data)
0 Related Data-Fields
There are no related data-fields
2 Applications
| Application ID | Title |
|---|
| 17689 | Genetic, environmental and lifestyle predictors of brain/cognitive-related outcomes. |
| 22783 | The joint analysis of imaging data and genetic data for early tumor detection, prevention, diagnosis and treatment |

