Data
83,911 items of data are available, covering 79,384 participants.
Defined-instances run from 2 to 3, labelled using Instancing
2.
Units of measurement are AU.
| Maximum | 0.723515 |
| Decile 9 | 0.64463 |
| Decile 8 | 0.631763 |
| Decile 7 | 0.621816 |
| Decile 6 | 0.613092 |
| Median | 0.604537 |
| Decile 4 | 0.595626 |
| Decile 3 | 0.58564 |
| Decile 2 | 0.57274 |
| Decile 1 | 0.55257 |
| Minimum | 0 |
|
|
- Mean = 0.600796
- Std.dev = 0.0377739
- 251 items below graph minimum of 0.46051
|
2 Instances
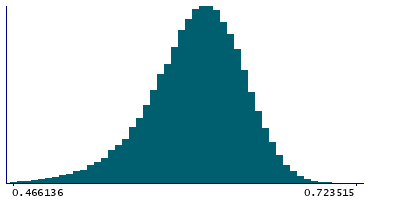
Instance 2 : Imaging visit (2014+)
79,153 participants, 79,153 items
| Maximum | 0.723515 |
| Decile 9 | 0.644429 |
| Decile 8 | 0.631553 |
| Decile 7 | 0.621618 |
| Decile 6 | 0.612828 |
| Median | 0.604297 |
| Decile 4 | 0.595303 |
| Decile 3 | 0.585276 |
| Decile 2 | 0.572388 |
| Decile 1 | 0.552169 |
| Minimum | 0 |
|

|
- Mean = 0.600509
- Std.dev = 0.0378918
- 239 items below graph minimum of 0.45991
|
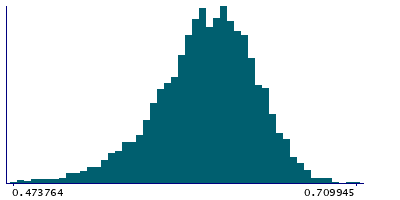
Instance 3 : First repeat imaging visit (2019+)
4,758 participants, 4,758 items
| Maximum | 0.709945 |
| Decile 9 | 0.647197 |
| Decile 8 | 0.634675 |
| Decile 7 | 0.625487 |
| Decile 6 | 0.617207 |
| Median | 0.608551 |
| Decile 4 | 0.600333 |
| Decile 3 | 0.591348 |
| Decile 2 | 0.578454 |
| Decile 1 | 0.560475 |
| Minimum | 0.393636 |
|
|
- Mean = 0.605561
- Std.dev = 0.0354175
- 14 items below graph minimum of 0.473753
|
Notes
Mean FA (fractional anisotropy) in posterior thalamic radiation (left) on FA skeleton (from dMRI data)
0 Related Data-Fields
There are no related data-fields
2 Applications
| Application ID | Title |
|---|
| 17689 | Genetic, environmental and lifestyle predictors of brain/cognitive-related outcomes. |
| 22783 | The joint analysis of imaging data and genetic data for early tumor detection, prevention, diagnosis and treatment |

