Data
83,911 items of data are available, covering 79,384 participants.
Defined-instances run from 2 to 3, labelled using Instancing
2.
Units of measurement are AU.
| Maximum | 0.688156 |
| Decile 9 | 0.597239 |
| Decile 8 | 0.584879 |
| Decile 7 | 0.575799 |
| Decile 6 | 0.567908 |
| Median | 0.560294 |
| Decile 4 | 0.552773 |
| Decile 3 | 0.544345 |
| Decile 2 | 0.534239 |
| Decile 1 | 0.519758 |
| Minimum | 0 |
|

|
- Mean = 0.559012
- Std.dev = 0.0312802
- 149 items below graph minimum of 0.442277
- 2 items above graph maximum of 0.674719
|
2 Instances
Instance 2 : Imaging visit (2014+)
79,153 participants, 79,153 items
| Maximum | 0.688156 |
| Decile 9 | 0.597179 |
| Decile 8 | 0.584836 |
| Decile 7 | 0.575723 |
| Decile 6 | 0.56784 |
| Median | 0.560208 |
| Decile 4 | 0.552678 |
| Decile 3 | 0.544199 |
| Decile 2 | 0.534079 |
| Decile 1 | 0.519626 |
| Minimum | 0 |
|
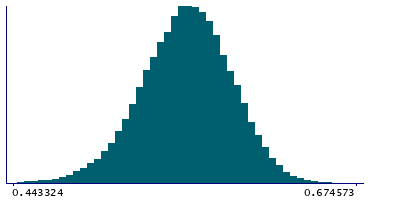
|
- Mean = 0.558906
- Std.dev = 0.0313425
- 143 items below graph minimum of 0.442073
- 2 items above graph maximum of 0.674732
|
Instance 3 : First repeat imaging visit (2019+)
4,758 participants, 4,758 items
| Maximum | 0.661337 |
| Decile 9 | 0.598073 |
| Decile 8 | 0.585777 |
| Decile 7 | 0.577143 |
| Decile 6 | 0.569113 |
| Median | 0.561645 |
| Decile 4 | 0.554447 |
| Decile 3 | 0.546593 |
| Decile 2 | 0.536558 |
| Decile 1 | 0.521995 |
| Minimum | 0.428491 |
|
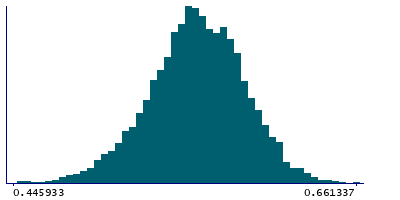
|
- Mean = 0.560764
- Std.dev = 0.0301721
- 6 items below graph minimum of 0.445917
|
Notes
Mean FA (fractional anisotropy) in sagittal stratum (right) on FA skeleton (from dMRI data)
0 Related Data-Fields
There are no related data-fields
2 Applications
| Application ID | Title |
|---|
| 17689 | Genetic, environmental and lifestyle predictors of brain/cognitive-related outcomes. |
| 22783 | The joint analysis of imaging data and genetic data for early tumor detection, prevention, diagnosis and treatment |

